


GOLD PRICE ANALYSIS: GOLD RALLIES AS NFP REPORT LOOMS, EMPLOYMENT DATA SIGNALS MASSIVE JOB LOSSES AMID CORONAVIRUS LOCKDOWN
- Gold topped $1,600 with the help of another dismal jobless claims report indicating a recession is likely unavoidable due to the ongoing coronavirus pandemic
- Gold price action faces a major technical resistance test, but fundamental tailwinds, like FOMC asset purchases and the expected freefall in NFP data, could fuel a breakout
- The precious metal might experience selling pressure if the upcoming nonfarm payrolls report sparks a flight into cash as the preferred safe-haven asset in lieu of gold
Spot gold (XAU/USD) jumped back above the $1,600/oz price level on Thursday in an extension of gains recorded during the prior trading session.The 1.5% spike in gold was driven largely by a terrifying rise in furloughed and laid off workers reported in back-to-back weeks of record-breaking jobless claims. Latest jobless claims data sends an ominous message ahead of the upcoming NFP report release due Friday, April 03 at 12:30 GMT.
| Change in | Longs | Shorts | OI |
| Daily | 3% | 8% | 5% |
| Weekly | 0% | -2% | -1% |
GOLD COULD CLIMB WITH US NONFARM PAYROLLS SET TO PLUNGE, UNEMPLOYMENT RATE TO SKYROCKET
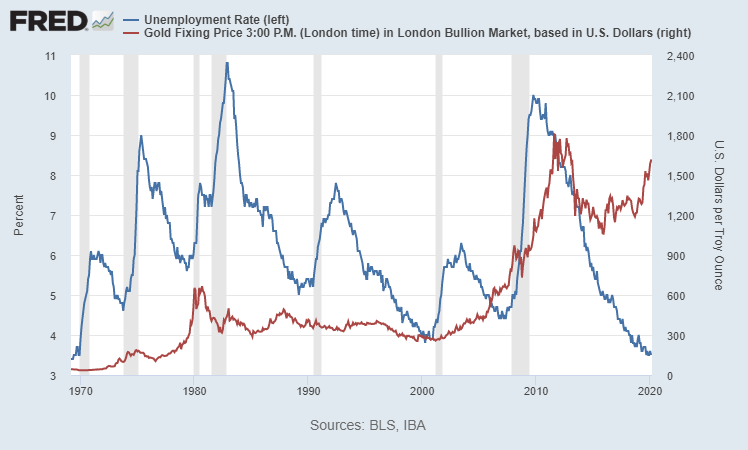
On that note, if the unemployment rate or net change in nonfarm payrolls materially miss consensus estimates of -100K and 3.8% respectively, the price of gold might springboard toward year-to-date-highs, as investors digest economic reality from the number of unemployed workers due to the ongoing coronavirus lockdown.

GOLD PRICE OUTLOOK REMAINS BULLISH AS FEDERAL RESERVE BALANCE SHEET BALLOONS
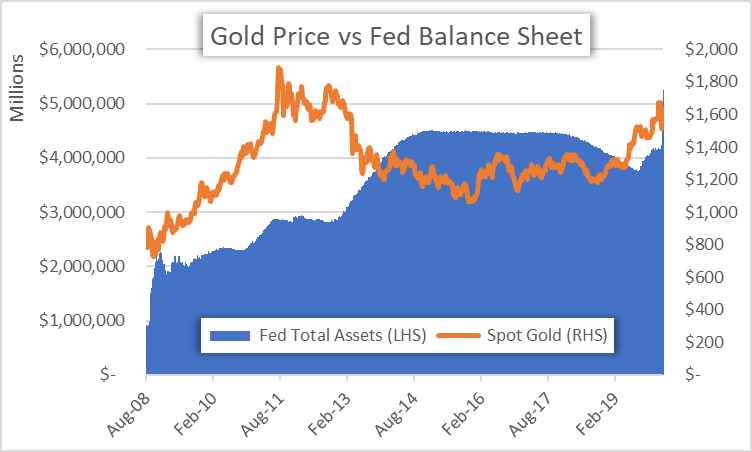
With the Fed exhausting one of its primary monetary policy tools used to boost the economy by cutting the benchmark Fed funds rate to zero, often referred to as hitting the zero-lower bound, the US central bank has reverted to an unconventional measure adopted during the last financial crisis: quantitative easing.
Read More – Gold Price to Resume Ascent as Fed Asset Purchases Balloon
Correspondingly, the Federal Reserve balance sheet has embarked on a near-vertical trajectory after exploding 40% last month to $5.81 trillion from $4.16 trillion. This wave of QE from the Fed, an unprecedented liquidity and inflationary stimulus supplemented by a $2 trillion coronavirus relief bill passed by the US government, stands to keep gold prices supported.

That said, as hard economic data paints a gloomy depiction of economic fallout caused by the coronavirus, perhaps like the upcoming NFP report, gold price action could soar in response. In addition to the precious metal’s safe-haven appeal, this is considering global central banks and governments will likely continue or ramp up recent stimulus efforts.
GOLD PRICE CHART: DAILY TIME FRAME (NOVEMBER 2019 TO APRIL 2020)
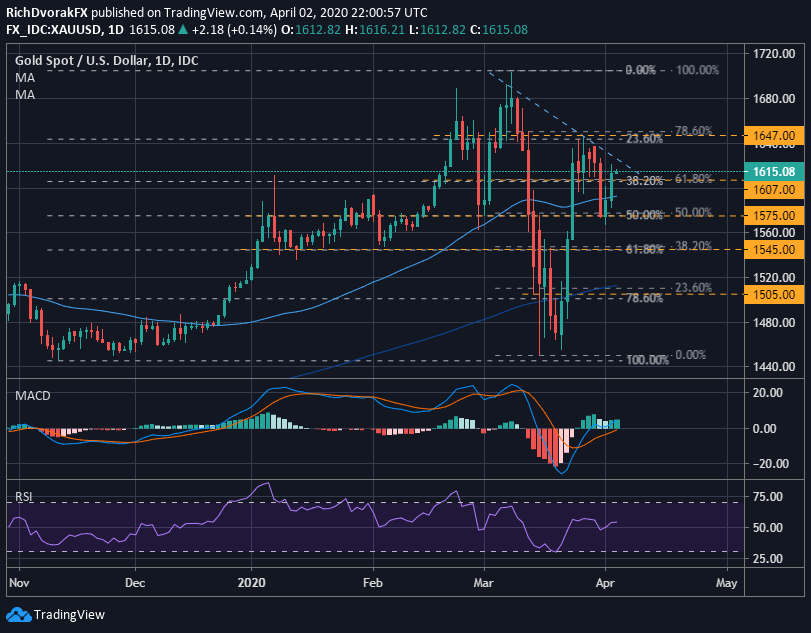
Chart created by @RichDvorakFX with TradingView
At the same time, the risk that another stock market rout might pressure gold back lower lingers during these volatile market conditions. Also, the technical backdrop behind XAU/USD is more ambiguous and less inspiring than its bullish fundamental underpinnings. Spot gold faces a negatively-sloped trendline of resistance extended through the series of lower highs recorded last month, which could serve as a short-term bearish headwind.

If the upcoming NFP report sparks a positive reaction in gold price action, the March 26 intraday high near $1,647 comes into focus as the first major obstacle faced by bullion bulls before targets are set on the March 09 peak above the $1,700 mark.
Looking to the downside, technical support might be found around the 50-day simple moving average, in addition to a confluence of Fibonacci retracement levels around the $1,575 price. If gold selling accelerates, XAU/USD bears could look toward the $1,545 and $1,505 zones for support.
-- Written by Rich Dvorak, Junior Analyst for DailyFX.com
Connect with @RichDvorakFX on Twitter for real-time market insight


