


Gold Prices Overview:
- The pullback in longer-end US Treasury yields is helping keep gold prices propped up as it continues to contend with its multi-month trend support.
- Precious metals underperform during periods of lower volatility as decreased uncertainty reduces the safe haven appeal of gold and silver. To this end, the 5-day correlation between GVZ and gold prices is 0.58, and the 20-day correlation is 0.76.
- Retail positioning warns that the current spot gold price trend may soon reverse higher despite the fact traders remain net-long.
Looking for longer-term forecasts on Gold and Silver prices? Check out the DailyFX Trading Guides.
The September Fed meeting produced significant volatility across asset classes, but not much meaningful price action. With Fed Chair Jerome Powell downplaying the chances of an aggressive interest rate cut cycle while at the same time promoting the idea that an expansion of the Fed’s balance sheet could begin again – QE4, anyone? – traders have had a lot to chew on over the past 24-hours.
As the September Fed meeting is digested, the next moves by markets could prove critical to precious metals complex. In previous gold price forecast updates we’ve outlined why US Treasury yields are a significant factor for movement in precious metals. To this end, the pullback in longer-end US Treasury yields, effectively producing an inverted yield curve, is helping keep gold prices propped up as it continues to contend with its multi-month trend support.
US Treasury 10-year Yield Technical Analysis: Daily Chart (June 2016 to SEPTEMBER 2019) (Chart 1)

Since hitting its highest level in five weeks on September 13 at 1.907%, the US Treasury 10-year yield has fallen back meaningfully. As traders deploy capital in the wake of the September Fed meeting, the US Treasury 10-year was yielding 1.773%. A further retracement by US Treasury yields should prove supportive of higher gold prices.
Shifts in US Treasury yields in recent weeks have largely reflected changes in rates markets around the timing of the Fed rate cut cycle. Another jump by US Treasury yields would be bad news for gold prices in the short-term – particularly if the catalyst was a path towards resolution in the US-China trade war.
Gold Prices Weighed Down by Easing Gold Volatility
While other asset classes don’t like increased volatility (signaling greater uncertainty around cash flows, dividends, coupon payments, etc.), precious metals tend to benefit during periods of higher volatility. Heightened uncertainty in financial markets due to increasing macroeconomic tensions (like US-China trade war or the prospect of a no-deal, hard Brexit, for example) increases the safe haven appeal of gold and silver.
On the other hand, reduced uncertainty in financial markets due to decreasing macroeconomic tensions (like the US-China trade war talks being announced for October or a no-deal, hard Brexit being postponed) decreases the desire to hold onto precious metals.
GVZ (Gold Volatility) Technical Analysis: Daily Price Chart (November 2016 to September 2019) (Chart 2)
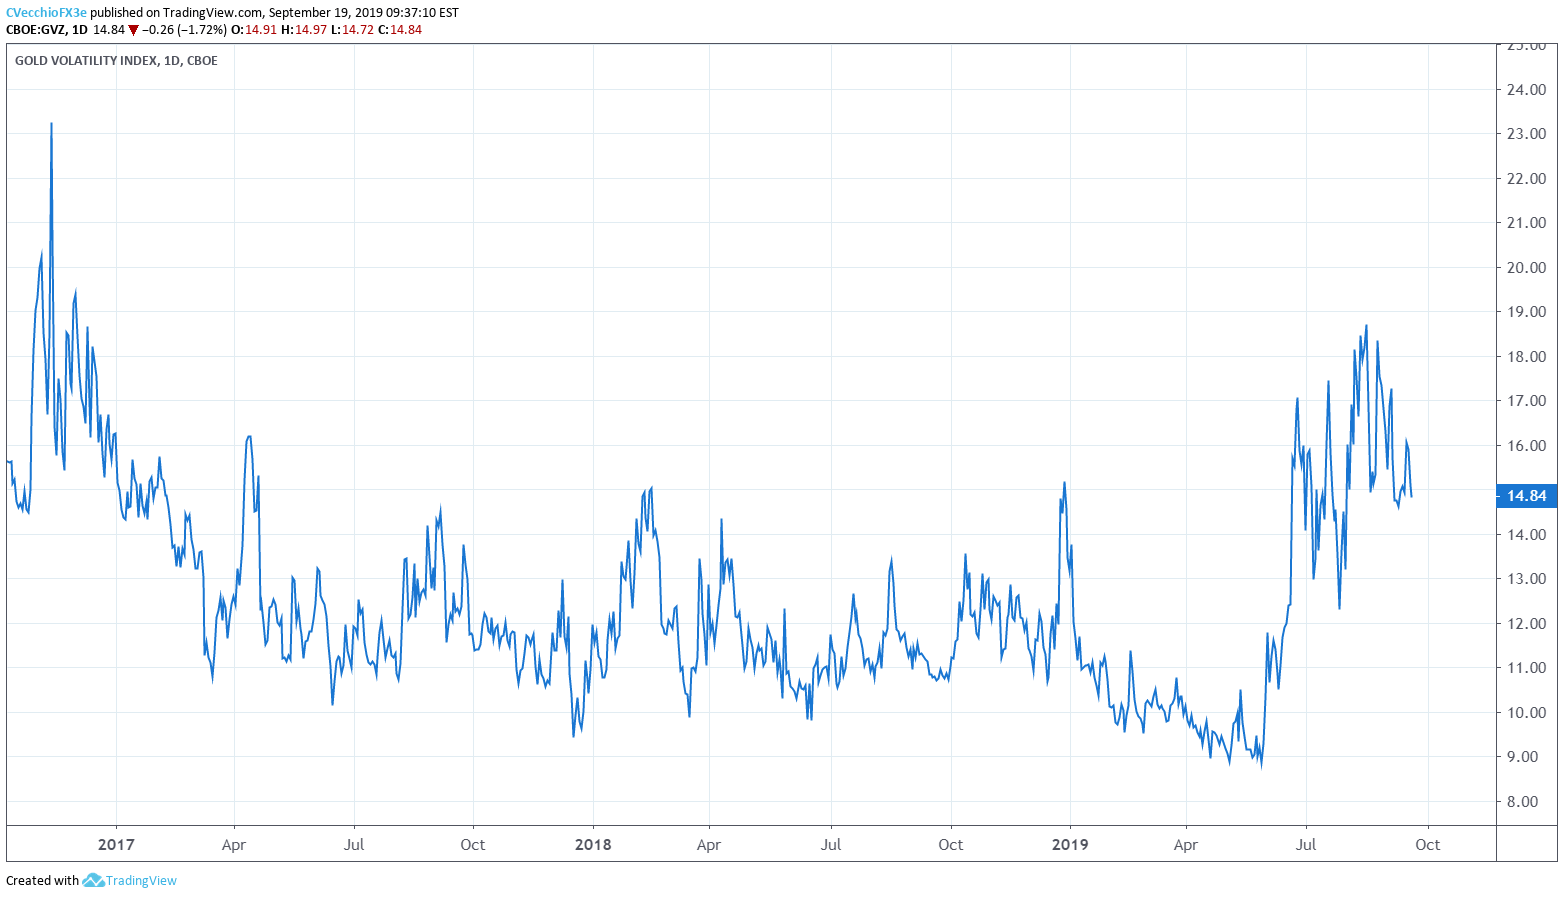
Gold volatility (as measured by the Cboe’s gold volatility ETF, GVZ, which tracks the 1-month implied volatility of gold as derived from the GLD option chain) has started to rebound, trading back up to 14.84 at the time of writing. Gold volatility levels remain below its 2019 high (and highest level since December 2017) set on August 15 at 18.72.
The 5-day correlation between GVZ and gold prices is 0.58, and the 20-day correlation is 0.76; four weeks ago, on August 20, the 5-day correlation was 0.83 and the 20-day correlation was 0.79. Once more, this is a situation reminiscent of what happened earlier: gold prices proved highly sensitive when gold volatility rises; but gold prices did not follow gold volatility when it unwound. What does this mean? There is a strong floor of support underneath gold prices at the moment.
Gold Price Technical Analysis: Daily Chart (AUGUST 2018 to SEPTEMBER 2019) (Chart 3)

Gold prices have been meandering sideways for several days now. Prices remain below the daily 8-, 13-, and 21-EMA envelope. Daily MACD continues to trend lower, although its decline is slowing, and it remains in bullish territory; Slow Stochastics are starting to rise out of oversold condition. A break above the September 12 high at 1524.05 would suggest the uptrend is resuming.
On the other hand, the August 13 doji candle support coincides with the rising trendline from the May 30 and August 1 lows, the backbone of the uptrend over the past four months. A break below this level around 1479.73 would suggest that a near-term top is in place for gold prices.
It thus holds that traders should remain neutral at present time, open to opportunities on both sides of the trade.
GOLD PRICE TECHNICAL ANALYSIS: WEEKLY CHART (AUGUST 2011 TO SEPTEMBER 2019) (CHART 4)
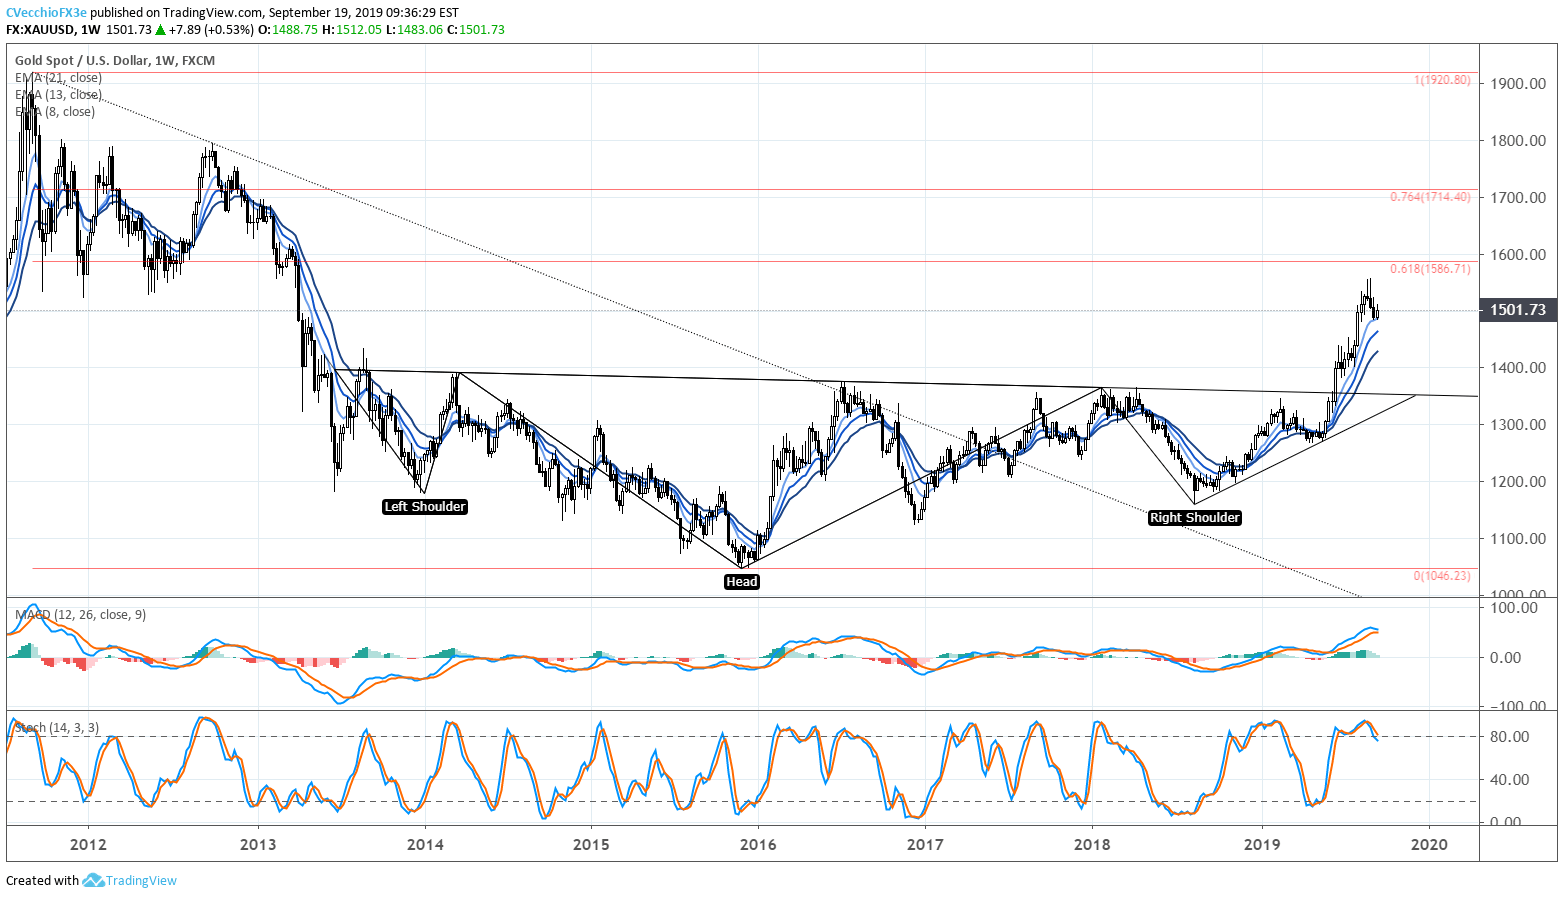
The longer-term gold price inverse head and shoulders pattern that commenced earlier this year remains valid at present time. The placement of the neckline determines the final upside targets in a potential long-term gold price rally: conservatively, drawing the neckline breakout against the January 2018 high at 1365.95; aggressively, drawing the neckline breakout against the August 2013 high at 1433.61 calls for a final target at 1820.99.
Gold prices continue to trade above their weekly 8-, 13-, and 21-EMA envelope having just re-tested the weekly 8-EMA for only the second time since the end of May (the other occurring on August 1). Weekly MACD has started to narrow and decline (albeit in bullish territory) Slow Stochastics continue to pullback from overbought territory.
Accordingly, while there have been signs of a short-term pause in the bull trend, there hasn’t been convincing enough price action to suggest that gold’s longer-term bullish multi-year inverse head and shoulders pattern has been invalidated – nor the uptrend since the May low.
IG Client Sentiment Index: Spot Gold Price Forecast (September 19, 2019) (Chart 5)

Spot gold: Retail trader data shows 68.4% of traders are net-long with the ratio of traders long to short at 2.16 to 1. The number of traders net-long is 3.9% lower than yesterday and 4.4% lower from last week, while the number of traders net-short is 1.9% higher than yesterday and 9.8% higher from last week.
We typically take a contrarian view to crowd sentiment, and the fact traders are net-long suggests spot gold prices may continue to fall. Yet traders are less net-long than yesterday and compared with last week. Recent changes in sentiment warn that the current spot gold price trend may soon reverse higher despite the fact traders remain net-long.
FX TRADING RESOURCES
Whether you are a new or experienced trader, DailyFX has multiple resources available to help you: an indicator for monitoring trader sentiment; quarterly trading forecasts; analytical and educational webinars held daily; trading guides to help you improve trading performance, and even one for those who are new to FX trading.
--- Written by Christopher Vecchio, CFA, Senior Currency Strategist
To contact Christopher Vecchio, e-mail at cvecchio@dailyfx.com
Follow him on Twitter at @CVecchioFX
View our long-term forecasts with the DailyFX Trading Guides


