


Gold Prices Overview:
- Gold prices have broken key moving averages that have served as support for over three months, setting up a challenge of the overall uptrend since the end of May.
- Precious metals underperform during periods of lower volatility as decreased uncertainty reduces the safe haven appeal of gold and silver. To this end, the 5-day correlation between GVZ and gold prices is 0.98; and the 20-day correlation is 0.54.
- Retail positioning warns that the current spot gold price trend may continue lower in the short-term.
Looking for longer-term forecasts on Gold and Silver prices? Check out the DailyFX Trading Guides.
The start of trading after the end of summer has produced quieter market conditions than most expected. With the US-China trade war simmering in a state of truce as both countries await negotiations in October, and now that the odds of a no-deal, hard Brexit have been reduced, the two major concerns from over the summer have seemingly dissipated.
In an environment defined by reduced uncertainty has diminished the need for market participants to hold onto lower yielding currencies and safe haven assets, in turn favoring equities. It’s important to take note of the fact that US Treasury yields continue to push higher, undercutting one of the key aspects of the bullish argument for gold prices.
Why Do ‘Real Yields’ Matter to Gold Prices?
The shifts in US Treasury yields around the latest US-China trade war news feeds directly into one of the most important fundamental underpinnings of precious metals’ rallies: environments that produce falling real yields tend to be the most bullish. On the other hand, environments that produce rising real yields tend to be the most bearish for precious metals.
Real yields are inflation-adjusted yields: in this case, the US Treasury 10-year yield minus the headline inflation rate. Why does this matter? Investing is all about asset allocation and risk-adjusted returns. On the asset allocation side, it’s about achieving required returns given the investor’s wants and needs.
If inflation expectations are rapidly increasing, you would expect to see fixed income underperform: the returns are fixed, after all. Why would you want to have a fixed return when prices are increasing? On a real basis, your returns would be lower than otherwise intended.
Rising US real yields means that the spread between Treasury yields and inflation rates isincreasing. If precious metals yield nothing (no dividends, coupons, or cash flows), they would be ill-suited to hold when US real yields rose.
Gold Price Rally Undermined by Falling Gold Volatility
While other asset classes don’t like increased volatility (signaling greater uncertainty around cash flows, dividends, coupon payments, etc.), precious metals tend to benefit during periods of higher volatility as heightened uncertainty (like the US-China trade war or Brexit, for example) increases the safe haven appeal of gold and silver. On the other hand, reduced uncertainty (like the US-China trade war talks being announced for October or a no-deal, hard Brexit being postponed) decreases the desire to hold onto precious metals.
GVZ (Gold Volatility) Technical Analysis: Daily Price Chart (November 2016 to September 2019) (Chart 1)
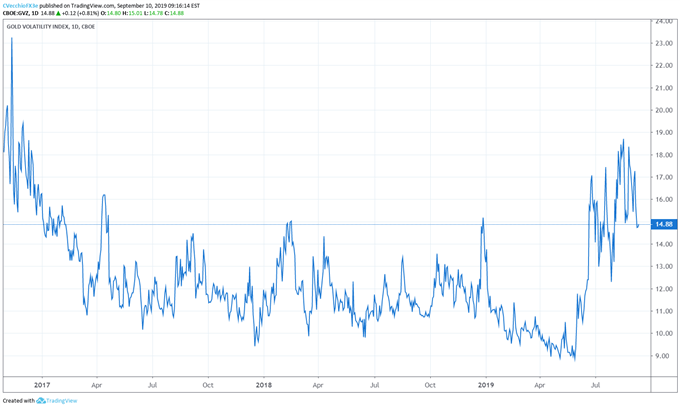
Gold volatility (as measured by the Cboe’s gold volatility ETF, GVZ, which tracks the 1-month implied volatility of gold as derived from the GLD option chain) has slipped again, back down to 14.88, but remains above its four-week low on August 21 at 10.98. Gold volatility levels continue to come down sharply from their 2019 high (and highest level since December 2017) at 18.72.
The 5-day correlation between GVZ and gold prices is 0.98; and the 20-day correlation is 0.54 (one month ago, on August 9, the 5-day correlation was 0.80 and the 20-day correlation was 0.61). It would thus follow that gold prices will remain weak so long as gold volatility continues to trend lower.
Gold Price Technical Analysis: Daily Chart (AUGUST 2018 to SEPTEMBER 2019) (Chart 2)
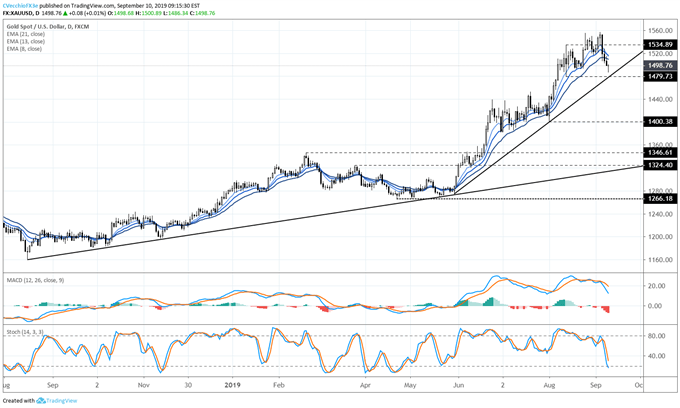
In our most recent gold price technical forecast update, it was noted that “the daily 13-EMA [is] proving as significant support just like it did during the pullback in gold prices in mid-August…The measured move for the bullish breakout around the August 13 doji candle range by gold prices is 1590.05.” The bullish breakout attempt failed last week, and coming into trading today, gold prices had fallen below their daily 8-, 13-, and 21-EMA envelope.
Needless to say, a lot of technical damage has been done to the gold price rally (particularly in light of the failed breakout attempt). Gold prices closed below their daily 21-EMA for two consecutive days on September 6 and 9, the first time such an event has occurred since May 28 and 29 – right before the May 30 bullish outside engulfing bar/key reversal that commenced the bull run that saw gold prices gain 22.1% from their low on May 30 to their 2019 high set on September 4.
Once more, the August 13 doji candle is coming into play. The doji support coincides with the rising trendline from the May 30 and August 1 lows, the backbone of the uptrend over the past four months. A break below this level around 1479.73 would suggest that a near-term top is in place for gold prices.
GOLD PRICE TECHNICAL ANALYSIS: WEEKLY CHART (AUGUST 2011 TO SEPTEMBER 2019) (CHART 3)
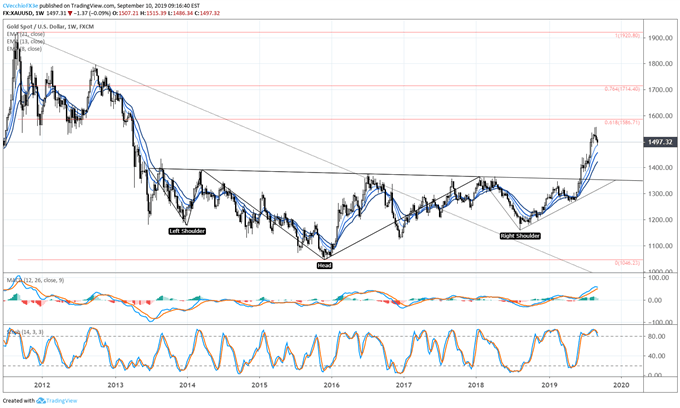
The longer-term bullish implications of the multi-year inverse head and shoulders pattern continue to guide gold prices – for now. When the gold price inverse head and shoulders pattern began to breakout in June, it was noted that “the placement of the neckline determines the final upside targets in a potential long-term gold price rally: conservatively, drawing the neckline breakout against the January 2018 high at 1365.95; aggressively, drawing the neckline breakout against the August 2013 high at 1433.61 calls for a final target at 1820.99.”
Gold prices continue to trade above the weekly 8- (two-month) and 13-EMAs (one-quarter), and gold prices are retesting the weekly 8-EMA for only the second time since the end of May (the other occurring on August 1). Weekly MACD continues to trend higher, although Slow Stochastics have started to pullback from overbought territory. The longer-term bullish forecast for gold prices remains intact, even if there is a near-term setback.
IG Client Sentiment Index: Spot Gold Price Forecast (September 10, 2019) (Chart 4)
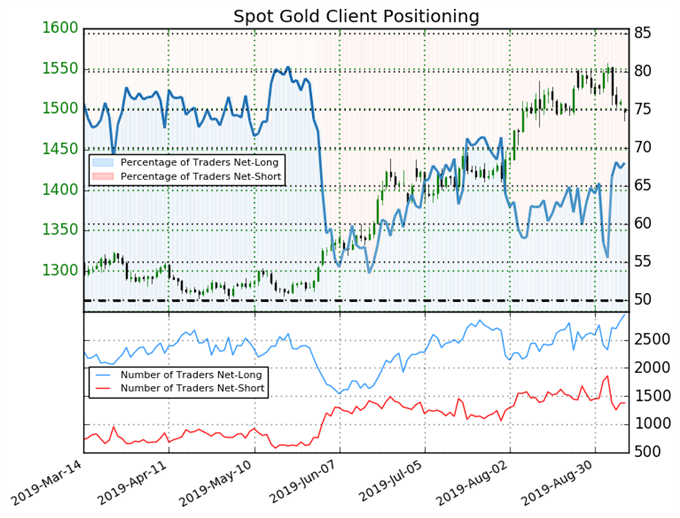
Spot gold: Retail trader data shows 68.0% of traders are net-long with the ratio of traders long to short at 2.13 to 1. The number of traders net-long is 3.7% higher than yesterday and 5.4% higher from last week, while the number of traders net-short is 2.1% lower than yesterday and 12.3% lower from last week.
We typically take a contrarian view to crowd sentiment, and the fact traders are net-long suggests spot gold prices may continue to fall. Traders are further net-long than yesterday and last week, and the combination of current sentiment and recent changes gives us a stronger spot gold-bearish contrarian trading bias.
FX TRADING RESOURCES
Whether you are a new or experienced trader, DailyFX has multiple resources available to help you: an indicator for monitoring trader sentiment; quarterly trading forecasts; analytical and educational webinars held daily; trading guides to help you improve trading performance, and even one for those who are new to FX trading.
--- Written by Christopher Vecchio, CFA, Senior Currency Strategist
To contact Christopher Vecchio, e-mail at cvecchio@dailyfx.com
Follow him on Twitter at @CVecchioFX
View our long-term forecasts with the DailyFX Trading Guides


