


Talking Points:
- Gold Prices remain bullish, but failure at the $1,300 psychological level highlights the potential for reversal.
- IG Client Sentiment for Gold is currently +1.58, as of this writing.
- If you’re looking for bigger picture analysis on Gold prices, please check out our Gold Forecast.
To receive James Stanley’s analysis directly via email, please SIGN UP HERE
In our last article, we looked at Gold prices approaching the key level of $1,296. This zone of resistance had twice reversed a bullish advance in Gold prices earlier in the year, and a double top had formed after the April and June bullish runs turned around at this level. As we were making a quick-advance higher as we came into last week, it seemed likely that another test of this key zone was in store; and after buyers were able to break out of that area of resistance, prices ran up to the key psychological level of $1,300.
Gold Daily: Fresh Post-Election Highs with Test of $1,300
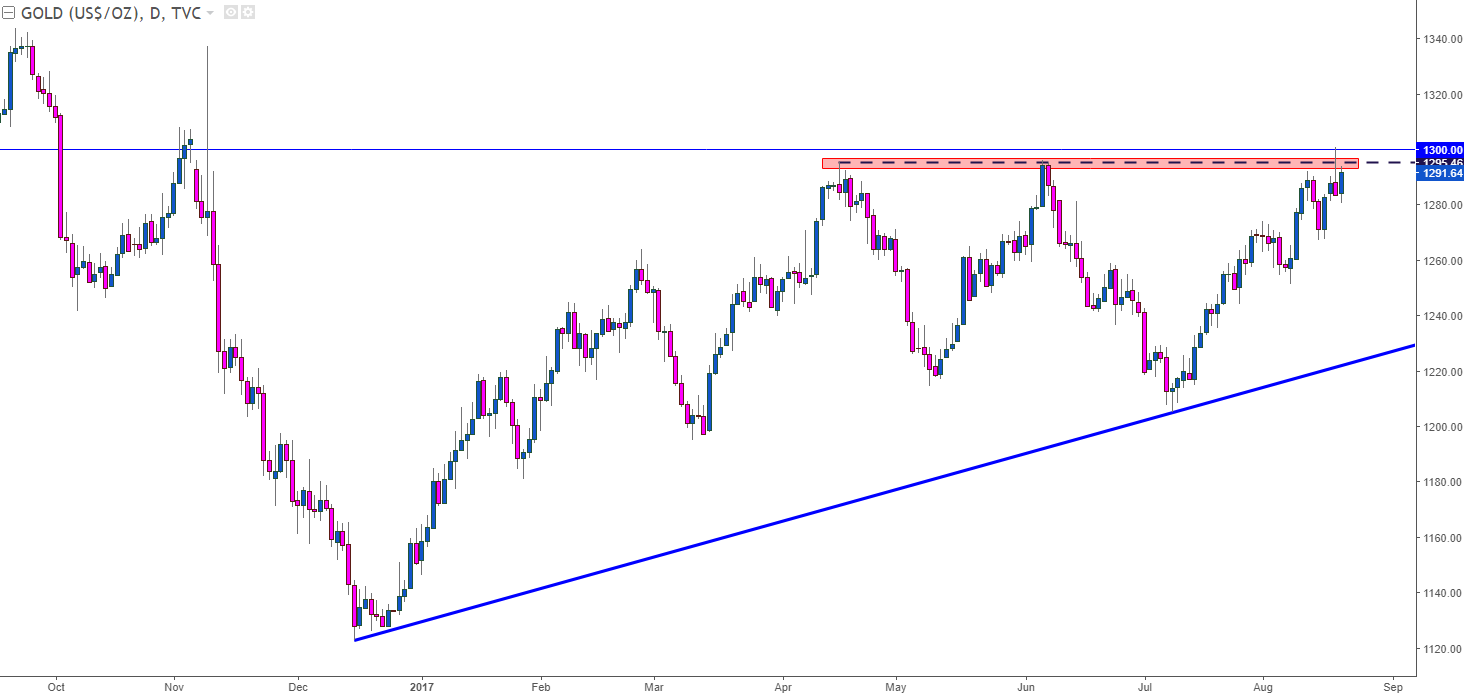
Chart prepared by James Stanley
After $1,300 came into play on Friday morning, however, sellers began to take over; and brought prices lower by more than $20 off the highs. This would denote a false breakout at $1,300 after the successful bullish breakout at $1,296. After peaking-out at $1,300.83 on Friday morning, support showed-up at $1,280.23 to open this week, and this is near the 38.2% retracement of the most recent bullish move (shown in blue below), taking the low on August 8th up to the Friday morning high. As buyers have slowly begun to trickle back in, prices have lifted above the 23.6% of this move, and are now showing support at a prior area of resistance (shown in orange below).
Gold Hourly: Buyers Respond to 38.2% Support Test, Support at Prior Resistance (23.6%)
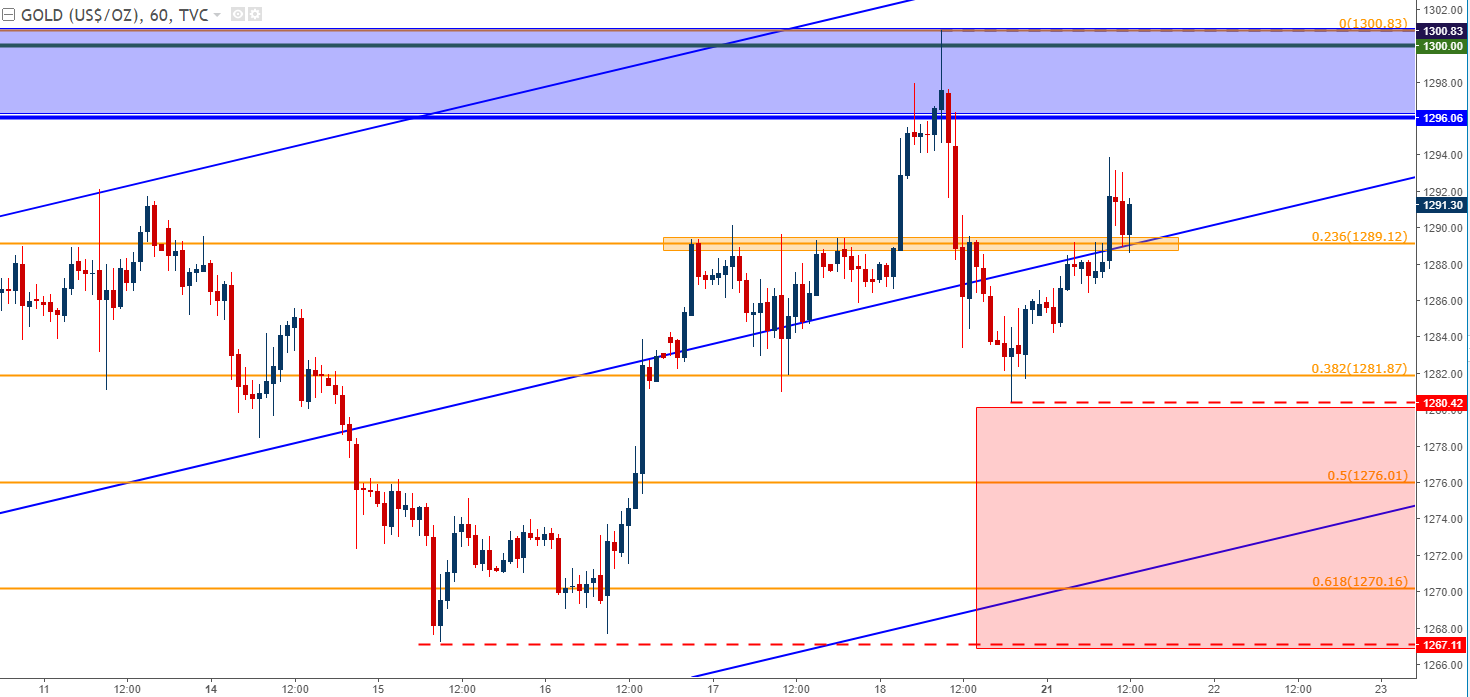
Chart prepared by James Stanley
As we approach a pivotal event on the calendar in the latter portion of this week with the start of the Jackson Hole Economic Symposium, there are potential setups on both sides of Gold at the moment. For the long side of Gold, traders will likely want to wait to let this area around $1,300 clear to ensure that bulls will be able to continue driving prices beyond this resistance. Around $1,307.50 is another potential resistance level, and this can be used to look for a deeper bullish move; should this level come into play, buyers can look to buy support at prior resistance (in the zone from $1,296-$1,300) with the aim of top-side continuation.
On the bearish side of Gold prices, a break below this week’s swing-low around $1,280 can open the door for a short-side setup with targets down to $1,276 and then $1,270. If the prior swing-low around $1,267 is taken-out, this opens the door for a deeper move towards the confluent zone around $1,250.
Gold Prices Four-Hour: V-Shaped Reversal Runs into Long-Term Resistance
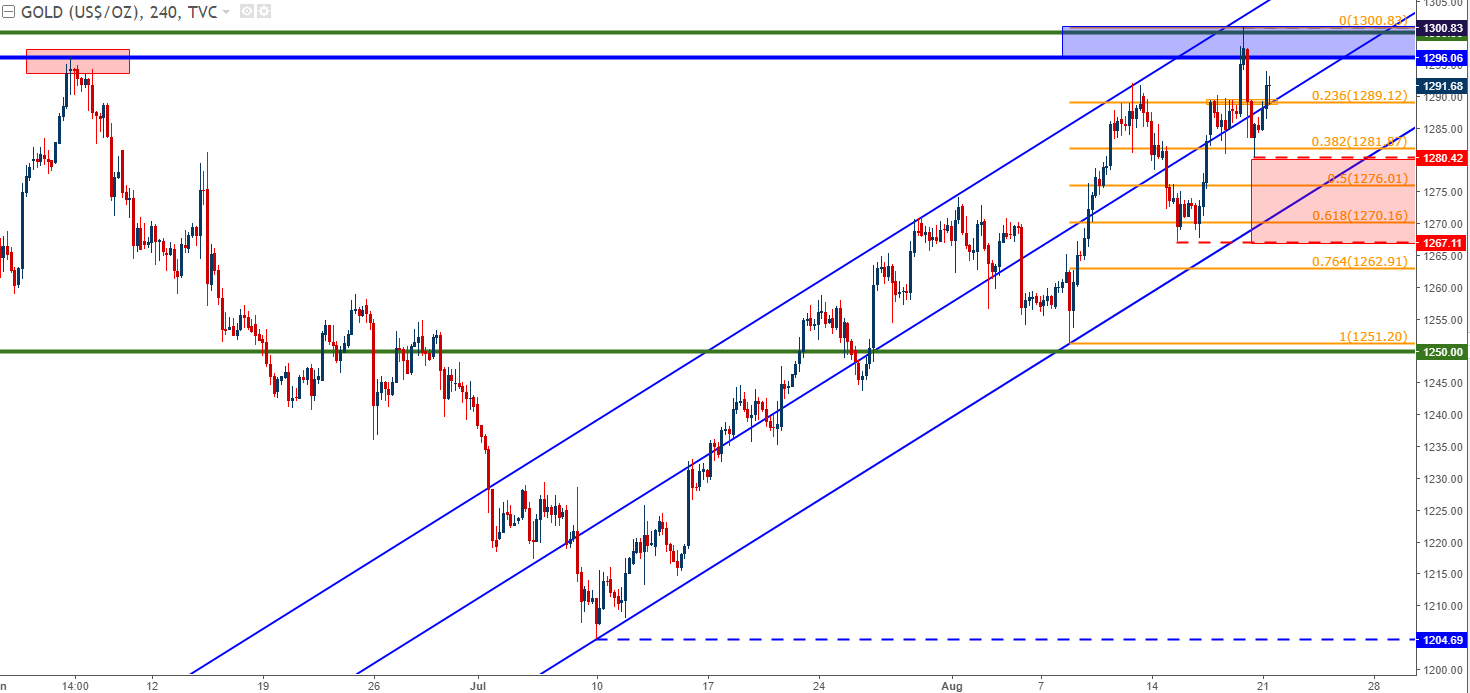
Chart prepared by James Stanley
--- Written by James Stanley, Strategist for DailyFX.com
To receive James Stanley’s analysis directly via email, please SIGN UP HERE
Contact and follow James on Twitter: @JStanleyFX


