


Gold/Silver Technical Highlights:
- Gold breaking November trend-line kicking off larger reversal
- Silver is on the verge of a lower-low after hitting major resistance
See what drivers DailyFX analysts expect to move Gold in the coming weeks in the Q1 Gold Forecast.
Gold breaking November trend-line kicking off larger reversal
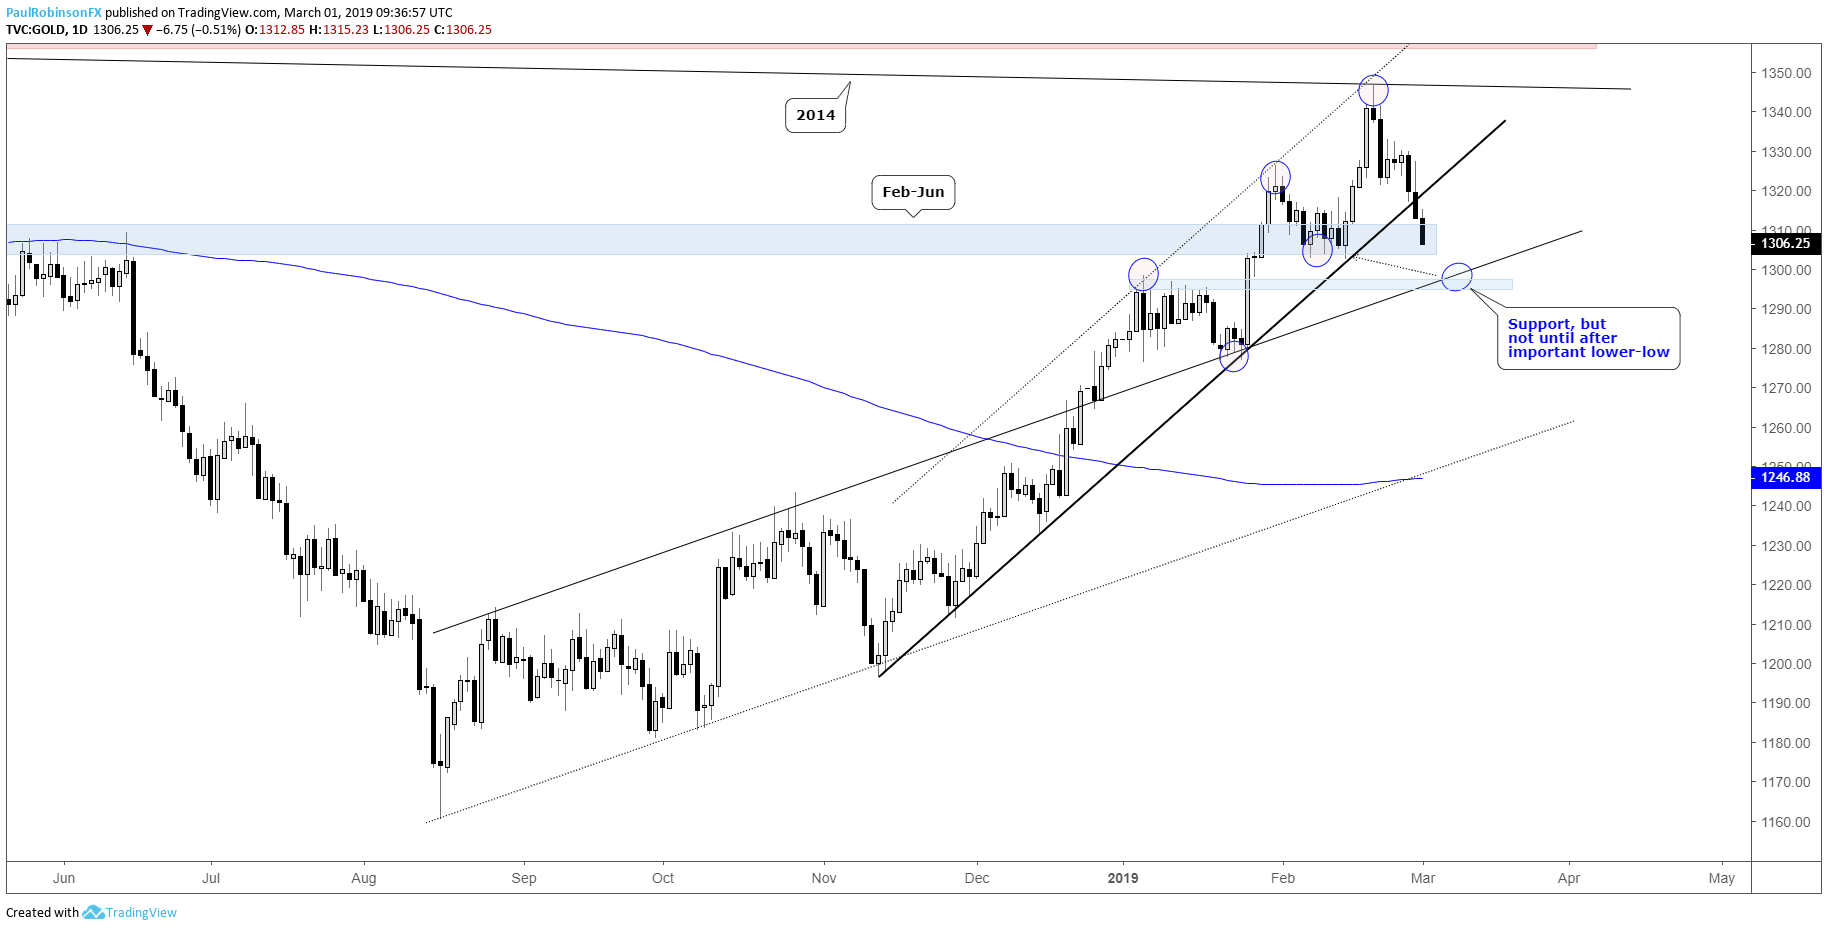
Yesterday, gold broke the November trend-line that I had in focus as keeping the metal pointed higher, and with the break we are seeing more selling so far today. Weakness now has the area just above 1300 in focus, a zone of support created last year and once again honored just last month.
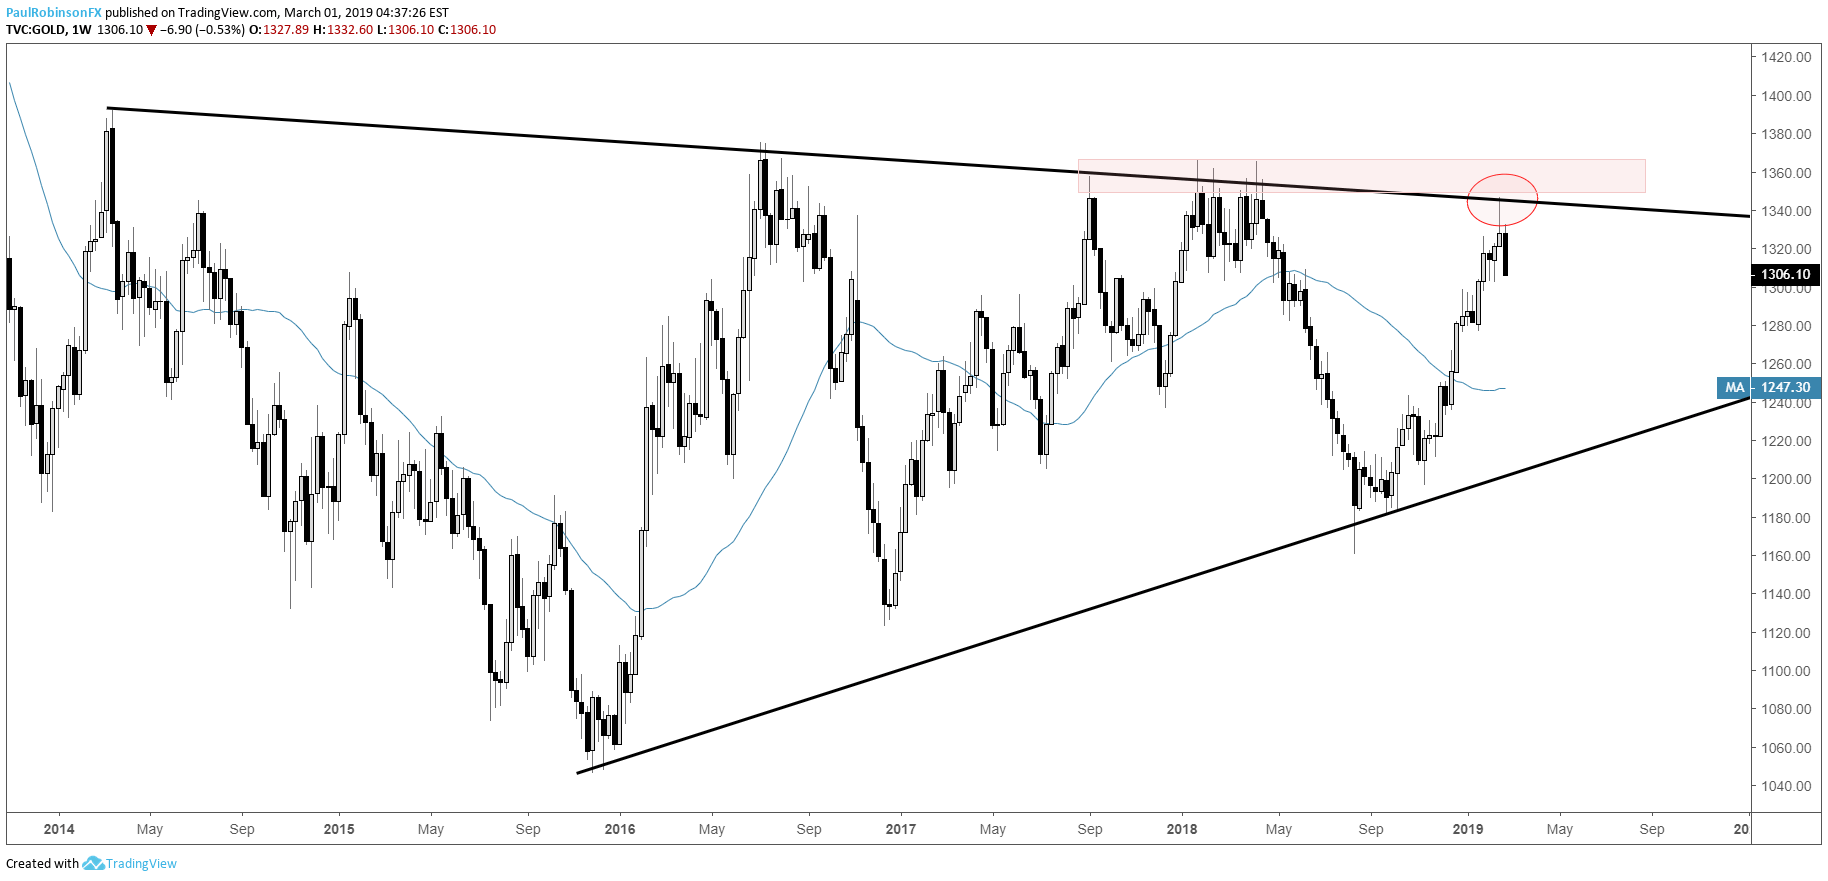
A breakdown below 1302 on a closing basis will be considered an important event as it will mark the first clear lower-low since the bullish sequence began few months ago. This event will also come after hitting a major area of long-term resistance.
There is a slope and price support from January just beneath the lower-low which may induce a bounce, however; with the trend structure becoming undermined after striking a major area of resistance (near 1350/2014 t-line), odds are stacking up that it could be one for sellers to take advantage of.
Check out the IG Client Sentiment page to see how changes in trader positioning can help signal the next price move in gold and other major markets.
Gold Daily Chart (Watch out for a lower-low)
Gold Weekly Chart (Reversal around long-term resistance)
Silver is on the verge of a lower-low after hitting major resistance
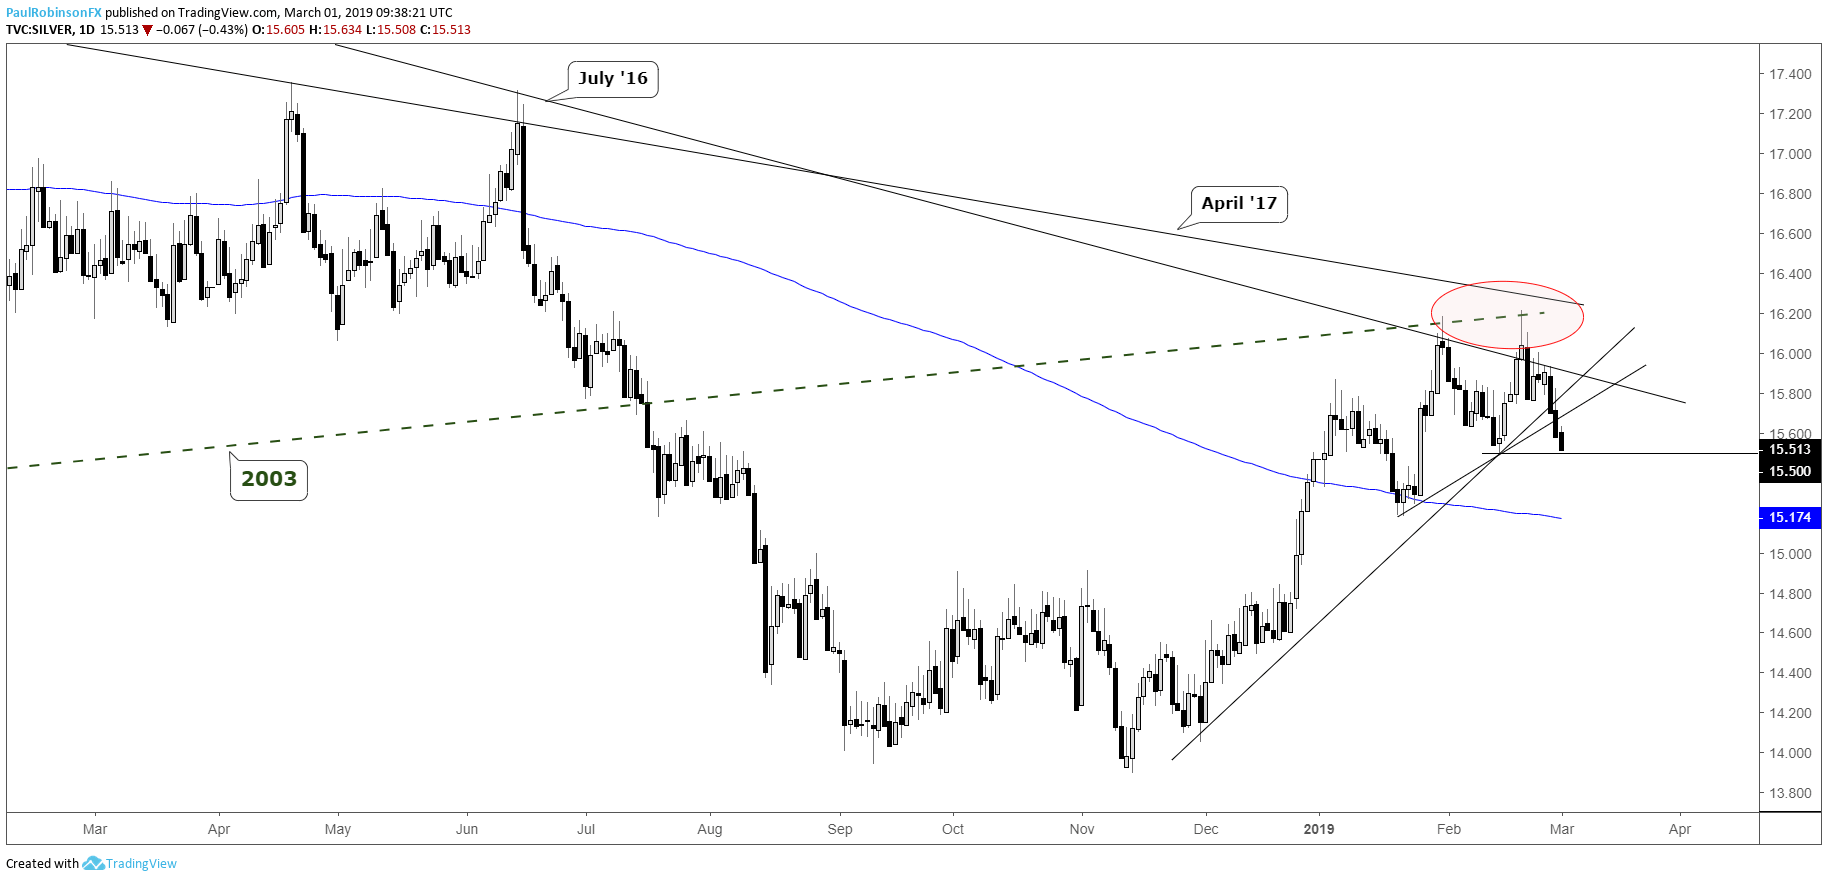
Silver continues to hold a weaker trend structure with it not having made the higher-high most recently with gold and now probing a lower-low from Feb 14. Minor trend-lines from November and January were broken yesterday. This turn of events in trend is coming from the stacked area of resistance consisting of the 2003, July 2016, and April 2017 trend-lines. Lower-low followed by a bounce may set silver up for a hard fall month.
Silver Daily Chart (On the verge of lower-low)
Resources for Forex & CFD Traders
Whether you are a new or experienced trader, we have several resources available to help you; indicator for tracking trader sentiment, quarterly trading forecasts, analytical and educational webinars held daily, trading guides to help you improve trading performance, and one specifically for those who are new to forex.
---Written by Paul Robinson, Market Analyst
You can follow Paul on Twitter at @PaulRobinsonFX


