


Crude Oil Outlook:
- Crude oil prices have turned sharply lower over the past two days, effectively bringing them back to where they were at last Thursday’s close.
- The two-month range continues to hold, and it remains the base case scenario that crude oil prices will trade between approximately 94.42 and 114.20 for the foreseeable future.
- According to the IG Client Sentiment Index, crude oil prices have a bullish bias in the near-term.
Trade Smarter - Sign up for the DailyFX Newsletter
Receive timely and compelling market commentary from the DailyFX team
Supply-Demand Headlines Dominate
Crude oil prices continue to slide after touching their highest level since March 24 in yesterday’s session. News that the United States may ease sanctions on Venezuela in an effort to bring more energy supply to global markets helped spark the downturn, as did comments by Federal Reserve Chair Jerome Powell regarding the Fed’s intent to continue to push forth with aggressive rate hikes.
But the ability for crude oil prices to move significantly lower remains in question as long as supply side concerns linger. OPEC+ is falling short of their production estimates, largely thanks to a -9% drop in Russian production in April. The US isn’t meeting the moment either, with crude oil production recently falling for the first time since January. Until the Russian invasion of Ukraine ends, the ensuing sanctions are lifted, and OPEC+ countries increase output, it’s likely supply side concerns persist.

Oil Volatility, Oil Price Correlation Remains Weak
Crude oil prices have a relationship with volatility like most other asset classes, especially those that have real economic uses – other energy assets, soft and hard metals, for example. Similar to how bonds and stocks don’t like increased volatility – signaling greater uncertainty around cash flows, dividends, coupon payments, etc. – crude oil tends to suffer during periods of higher volatility. Crude oil volatility holding steady at historically elevated levels has led to a disconnect in the correlation with oil prices.
OVX (Oil Volatility) Technical Analysis: Daily Price Chart (May 2021 to May 2022) (Chart 1)
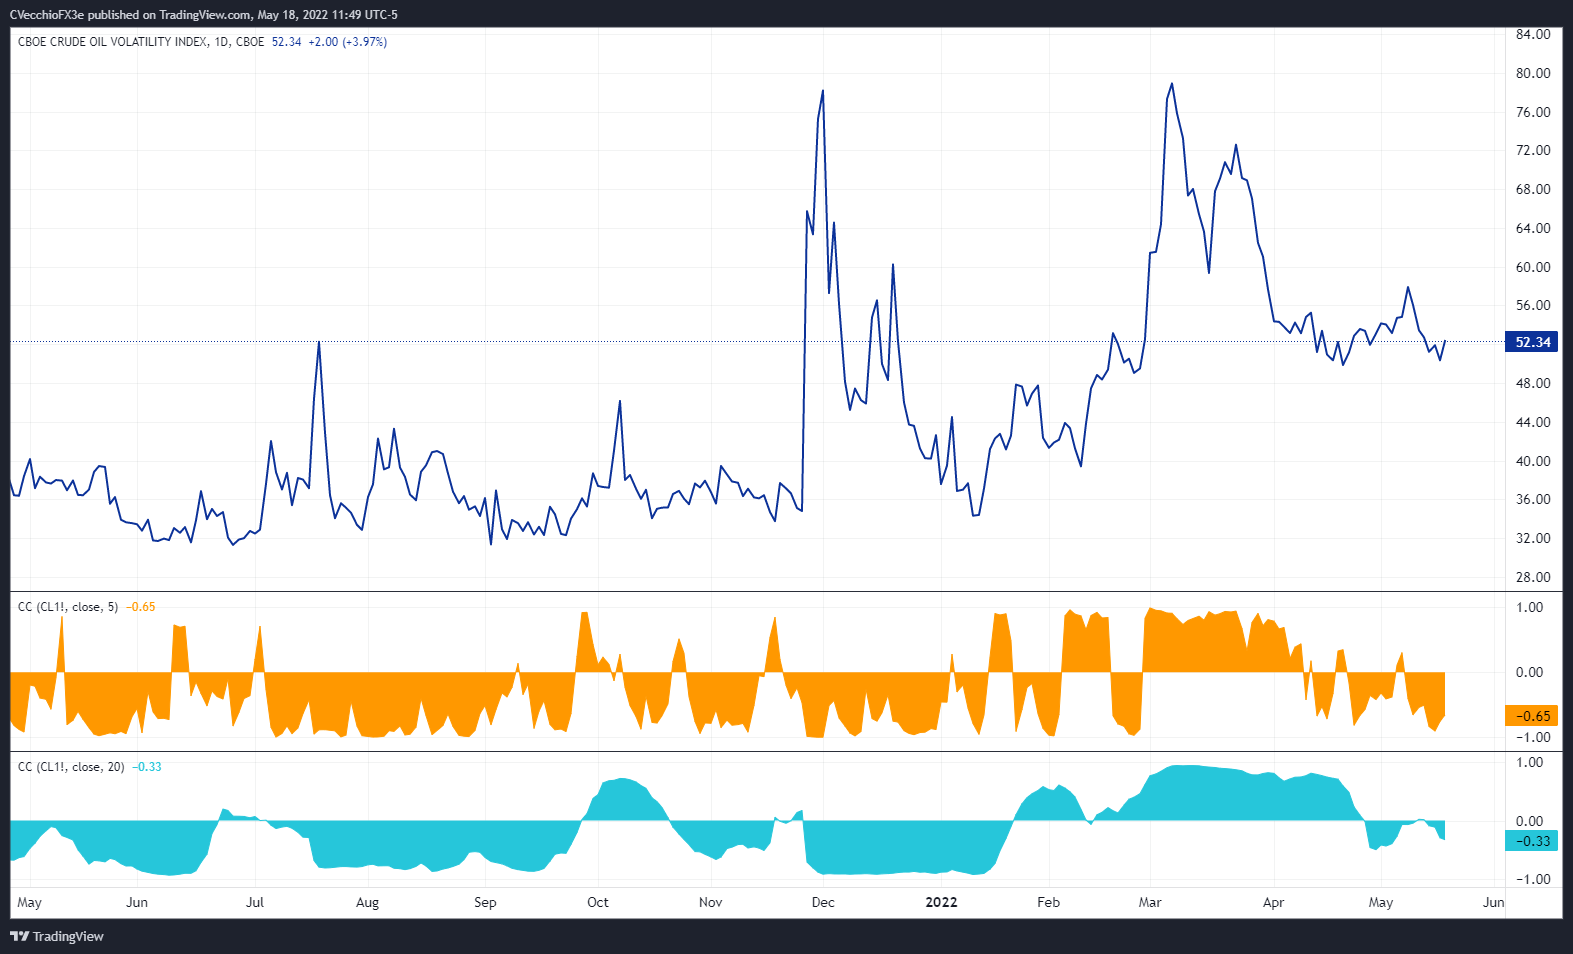
Oil volatility (as measured by the Cboe’s gold volatility ETF, OVX, which tracks the 1-month implied volatility of oil as derived from the USO option chain) was trading at 52.44 at the time this report was written, having held steady for the past six weeks. The 5-day correlation between OVX and crude oil prices is -0.65 while the 20-day correlation is -0.33. One week ago, on May 11, the 5-day correlation was -0.54 and the 20-day correlation was +0.02.

Crude Oil Price Technical Analysis: Daily Chart (October 2020 to May 2022) (Chart 2)
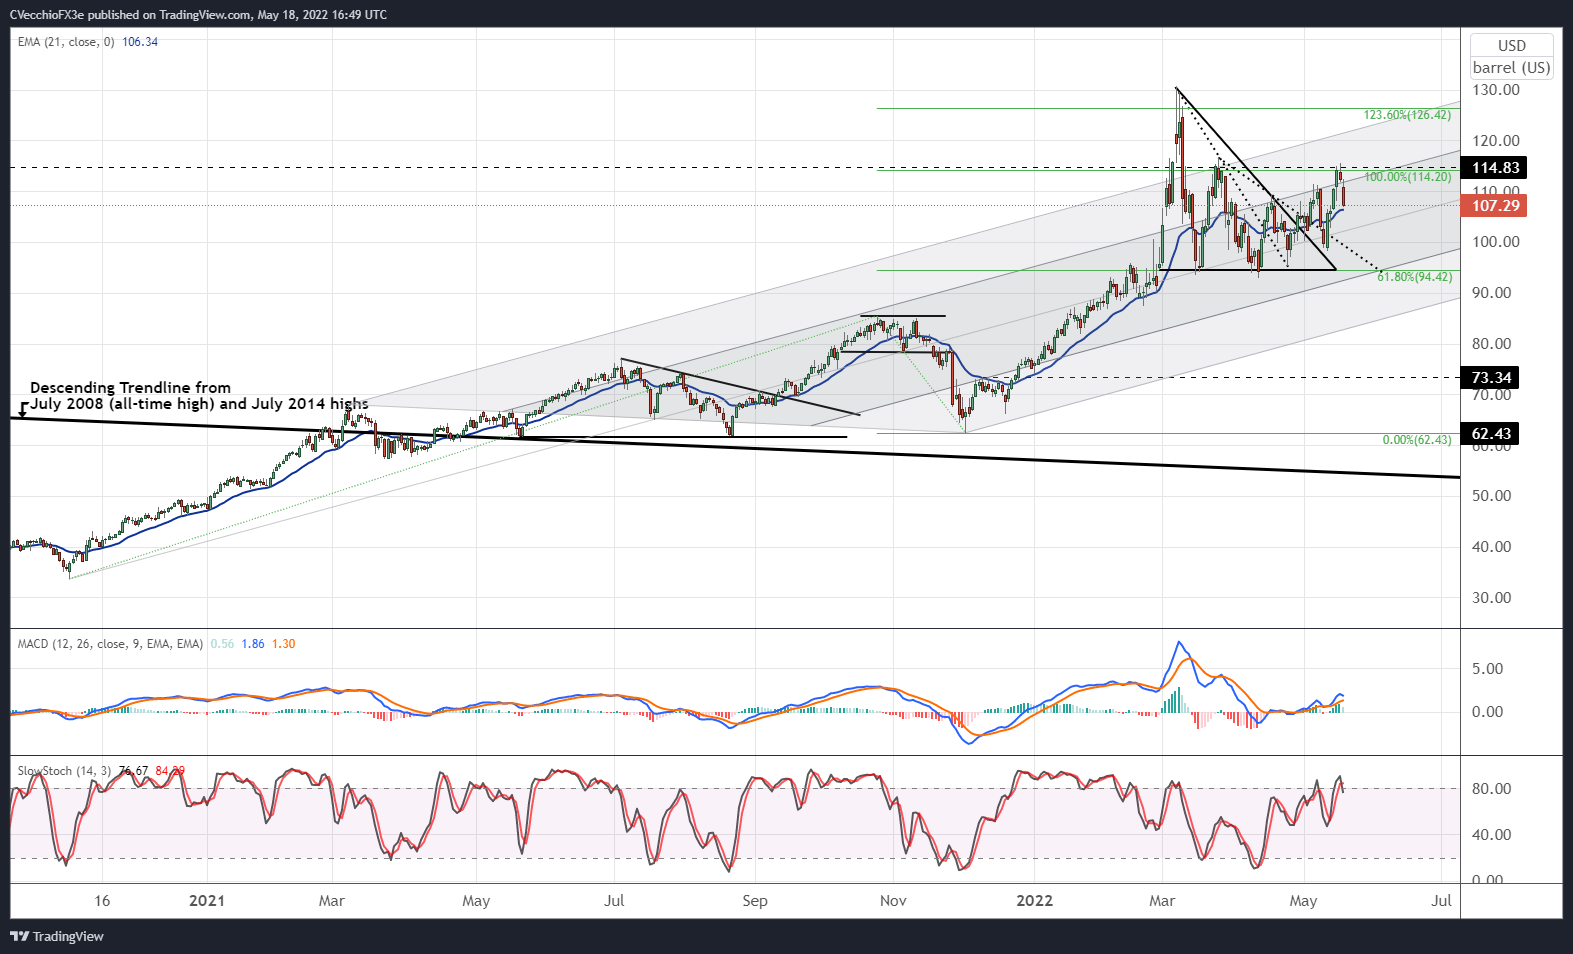
Despite a lot of two-way price action, not much has truly changed for crude oil prices. But for a few days in early-March, trading has been contained between the 61.8% and 100% Fibonacci extension levels (94.42 to 114.20) measured from the November 2020 low, October 2021 high, and December 2021. The recent breakout from the March/April triangles (the first – resistance drawn from the early- and mid-March swing highs – the second – resistance drawn from the early-March and April highs – and the third – drawn from the mid-March and April highs) produced a return to the high set on March 24 before failing.
It’s difficult to suggest that crude oil prices have sustainable bullish momentum. Crude oil prices below their daily 5-, 8-, 13-EMAs, but are finding support at their daily 21-EMA. The EMA envelope is no longer in bullish sequential order. Daily MACD is on the verge of issuing a sell signal (albeit above its signal line), while daily Slow Stochastics are about to exit overbought territory.
As was noted at the end of April, it remains the case that “traders should anticipate continued volatility within the recent two month range; the multiple percentage point moves within the range effectively means that crude oil prices are moving fast, but going nowhere.” It remains the base case scenario that crude oil prices will trade between approximately 94.42 and 114.20 for the foreseeable future.
Crude Oil Price Technical Analysis: Weekly Chart (March 2008 to May 2022) (Chart 3)
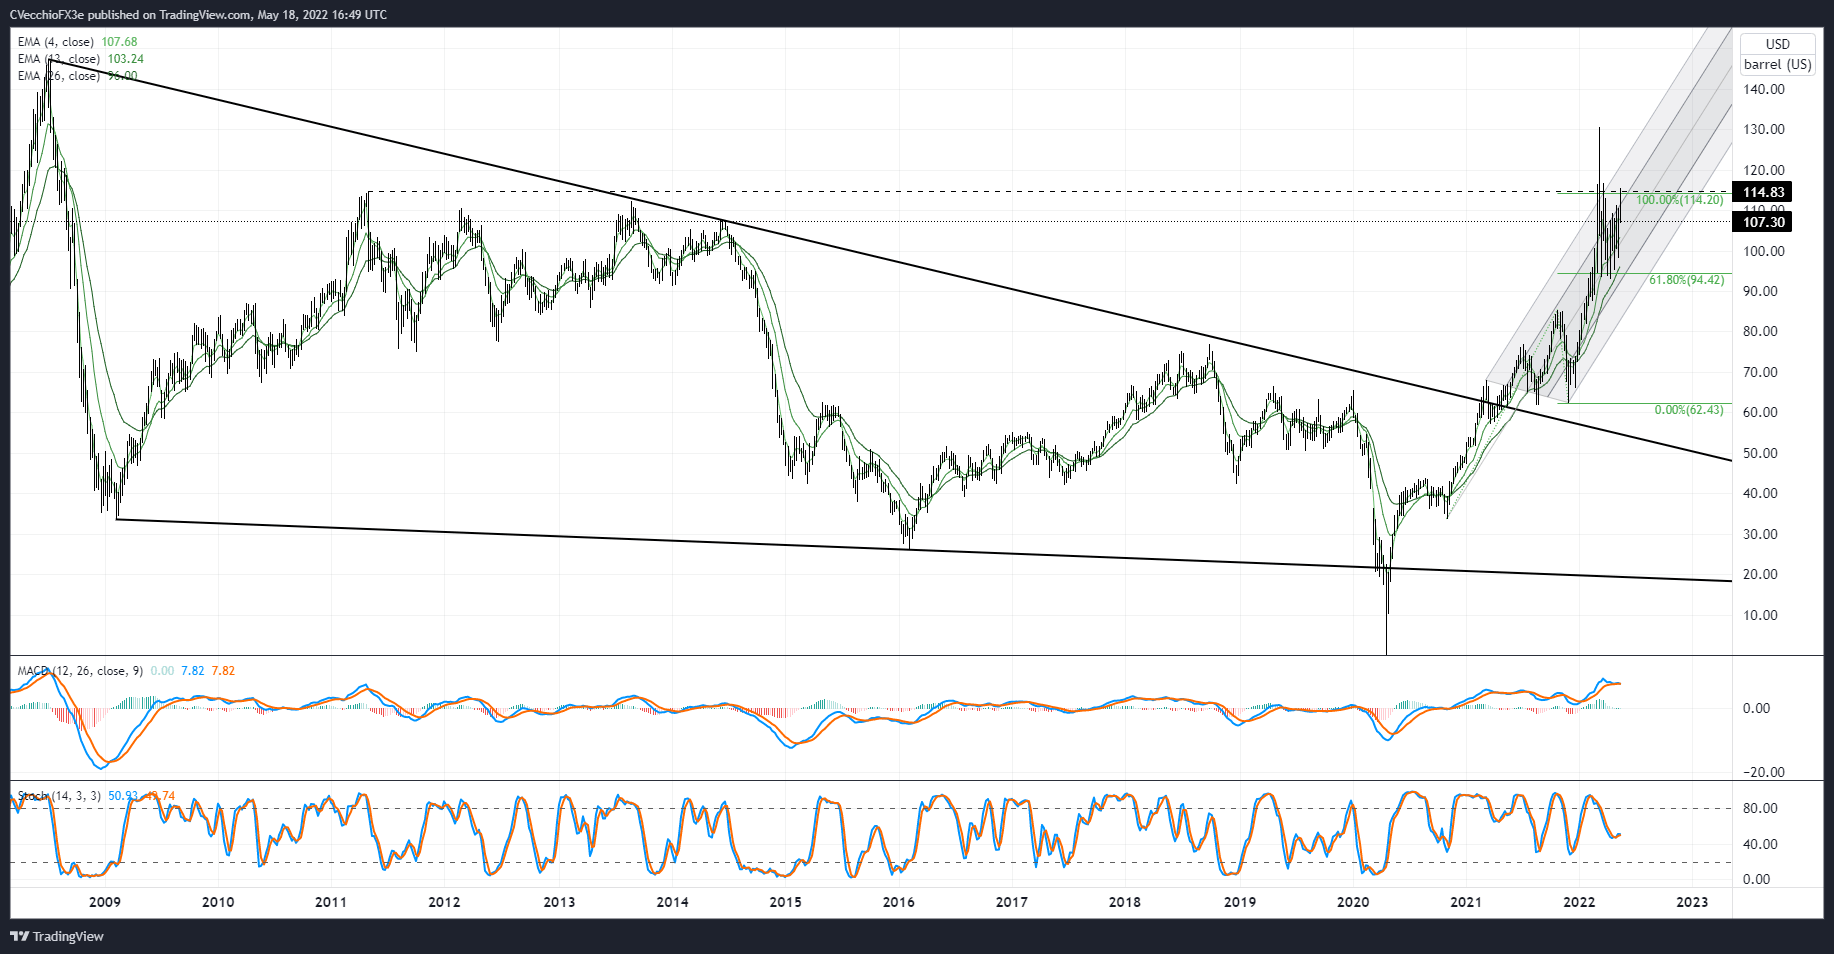
Nothing has changed materially since the end of April. “On the weekly timeframe, it remains clear that that bullish momentum has stalled.” Crude oil prices are slipping below their weekly 4-EMA, though the weekly 4-, 8-, and 13-EMA envelope remains in bullish sequential order. Weekly MACD is on the cusp of issuing a sell signal (albeit above its signal line) and weekly Slow Stochastics are barely holding above their median line. It still remains preferred to ‘focus on lower-term timeframes (4-hour, daily)…for the foreseeable future.’”

IG CLIENT SENTIMENT INDEX: CRUDE OIL PRICE FORECAST (May 18, 2022) (CHART 4)
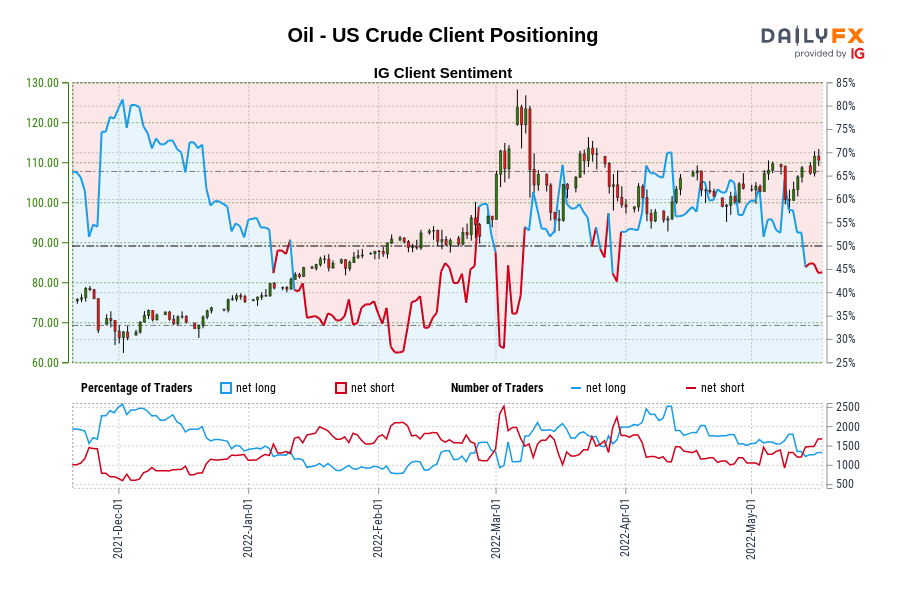
Oil - US Crude: Retail trader data shows 44.00% of traders are net-long with the ratio of traders short to long at 1.27 to 1. The number of traders net-long is 8.36% lower than yesterday and 13.35% lower from last week, while the number of traders net-short is 6.63% lower than yesterday and 38.29% higher from last week.
We typically take a contrarian view to crowd sentiment, and the fact traders are net-short suggests Oil - US Crude prices may continue to rise.
Traders are further net-short than yesterday and last week, and the combination of current sentiment and recent changes gives us a stronger Oil - US Crude-bullish contrarian trading bias.
Trade Smarter - Sign up for the DailyFX Newsletter
Receive timely and compelling market commentary from the DailyFX team
--- Written by Christopher Vecchio, CFA, Senior Strategist


