


USD/CAD Technical Highlights:
- USD/CAD facing short and long-term trend-lines
- Significant price resistance the 13330/82-area
The Canadian Dollar made a strong drive lower this week, putting itself below the 200-day MA versus the US Dollar, or above when looking at USD/CAD. The pair has a thicket of resistance to contend with, and if recent history is any guide it means we will likely see another turn down develop if it hasn’t already begun.
Crossing over from the September high is a trend-line touching the October peak. It’s not the strongest form of resistance, but nevertheless it’s a threshold worthy of attention. A bit more of a drive higher will have more significant levels coming under fire.
There is a trend-line running down from the 2016 cycle high, passing over peaks set in January and May. This line is also in confluence with significant price resistance created during the period from August to October. The zone is set at ~13330/82.
With yesterday’s modest down day and the prior session failing to finish near the high, it’s possible a top of sorts is already in. However, a more through testing of the aforementioned levels is preferred. An eventual turnabout that comes with volatility would be ideal to indicate sellers have gained the upper hand.
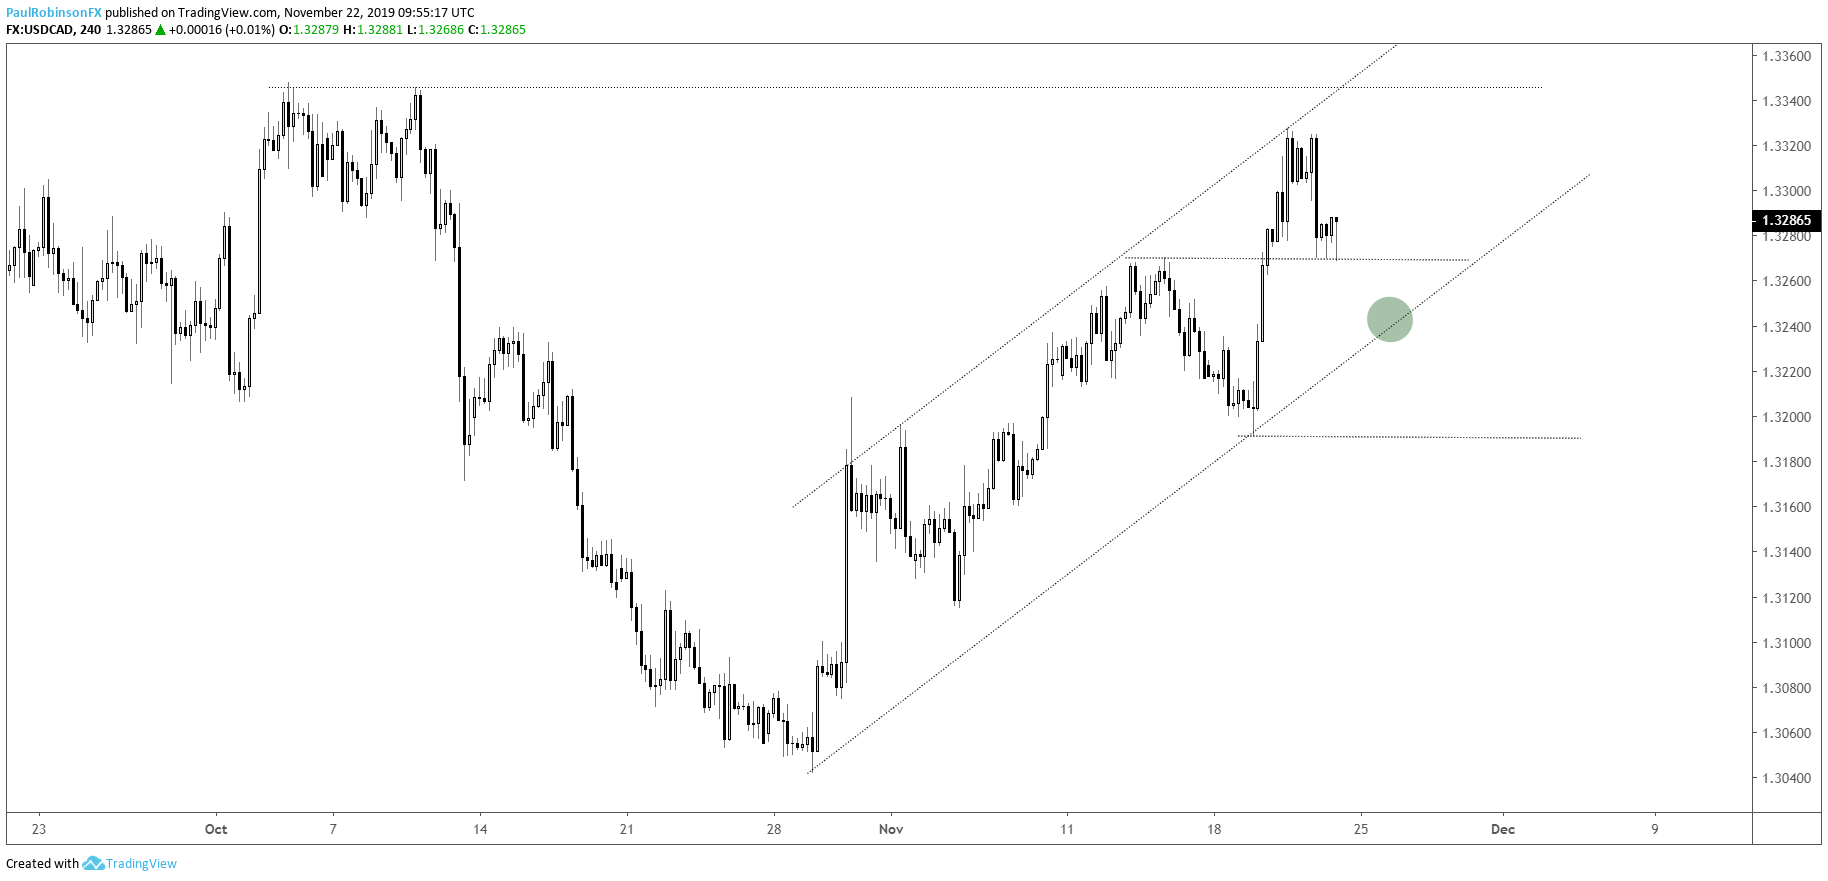
Turning to the 4-hr chart, it’s worth keeping in mind the channel forming off the late October low. As it currently stands, USD/CAD is carving out a sequence of higher-highs and higher-lows within the framework of this channel. Short-term traders can use it as a guide for further shaping their trading bias.
As long as the lower parallel holds, then price action will at least hold neutral, if not bullish. A break below, though, will open up room for resistance to gain more weight as risk rises that sellers will push the pair down in a meaningful manner.
Trading Forecasts and Educational Guides for traders of all experience levels can be found on the DailyFX Trading Guides page.
USD/CAD Daily Chart (thick resistance zone)

USD/CAD 4-hr Chart (watch channel structure)
***Updates will be provided on the above thoughts and others in the trading/technical outlook webinars held at 1030 GMT on Tuesday and Friday. If you are looking for ideas and feedback on how to improve your overall approach to trading, join me on Thursday each week for the Becoming a Better Trader webinar series.
Resources for Forex & CFD Traders
Whether you are a new or experienced trader, we have several resources available to help you; indicator for tracking trader sentiment, quarterly trading forecasts, analytical and educational webinars held daily, trading guides to help you improve trading performance, and one specifically for those who are new to forex.
---Written by Paul Robinson, Market Analyst
You can follow Paul on Twitter at @PaulRobinsonFX


