


What will happen to the USD as other central banks begin normalization? Click here to see our latest forecasts and find out what trades are developing in this new environment!
Talking Points:
- USD/CAD technical strategy: watching for signs retracement is ending, favoring downside
- Retracement zone of 1.2770-1.2680 from mid-July in focus as point for downtrend to resume
- IGCS Highlight: USD/CAD 80% long exposure favors contrarian’s downside bias
The runaway train that was the Canadian Dollar from mid-May to late July has taken a breather. Despite the geopolitical rhetoric from President Trump that North Korea could be met with Fire & Fury and a further seasonal fall in Crude Oil inventories, CAD remains on the defensive in the short-term. While the summer lull can be to blame, traders likely expected the DoE data to favor a rise in Crude Oil as well as a geopolitical threat to do the same, but alas, Crude Oil continues to triangulate. Therefore, we do not have the environment that favors the CAD trend continuing now, but that does not mean hope is lost.
Looking at the chart below, the key pivot where price recently extended higher from at the beginning of the month is 1.25550. That will be looked to as support for the presumably corrective move higher. Resistance will be looked through from the lens of a double bottom 100% extension target that sits near 1.2750 and a price range that encompasses the corrective move after the early July trounce on USD that took USD/CAD well below 1.3000 for the first time this year. The corrective zone is a ~100-pip range of 1.2770 (July 13 high) -1.2670 (July 12 low), which is highlighted on the chart below.
An Elliott Wave framework would see this move as a likely Wave 4, which means there is still a new low likely to be produced. While price can move higher than the resistance mentioned above near 1.2750/1.2770, I would prefer to watch for the continuation of the downtrend as evidenced by the daily close below 1.2550. Awaiting a continuation of the trend you’re anticipating can be a helpful way to stay out of new trends going against consensus and instead give up a few points on the front end in hopes of catching the continuation of the trend you’re looking to join as it's building steam. A daily close above 1.2270 would force a refocus and would turn my attention to a deeper retracement toward 1.2850.
Join Tyler at his Daily Closing Bell webinars at 3 pm ET to discuss key market developments.
Hourly USD/CAD Chart: Bounce may find resistance from further advancement near 1.2750
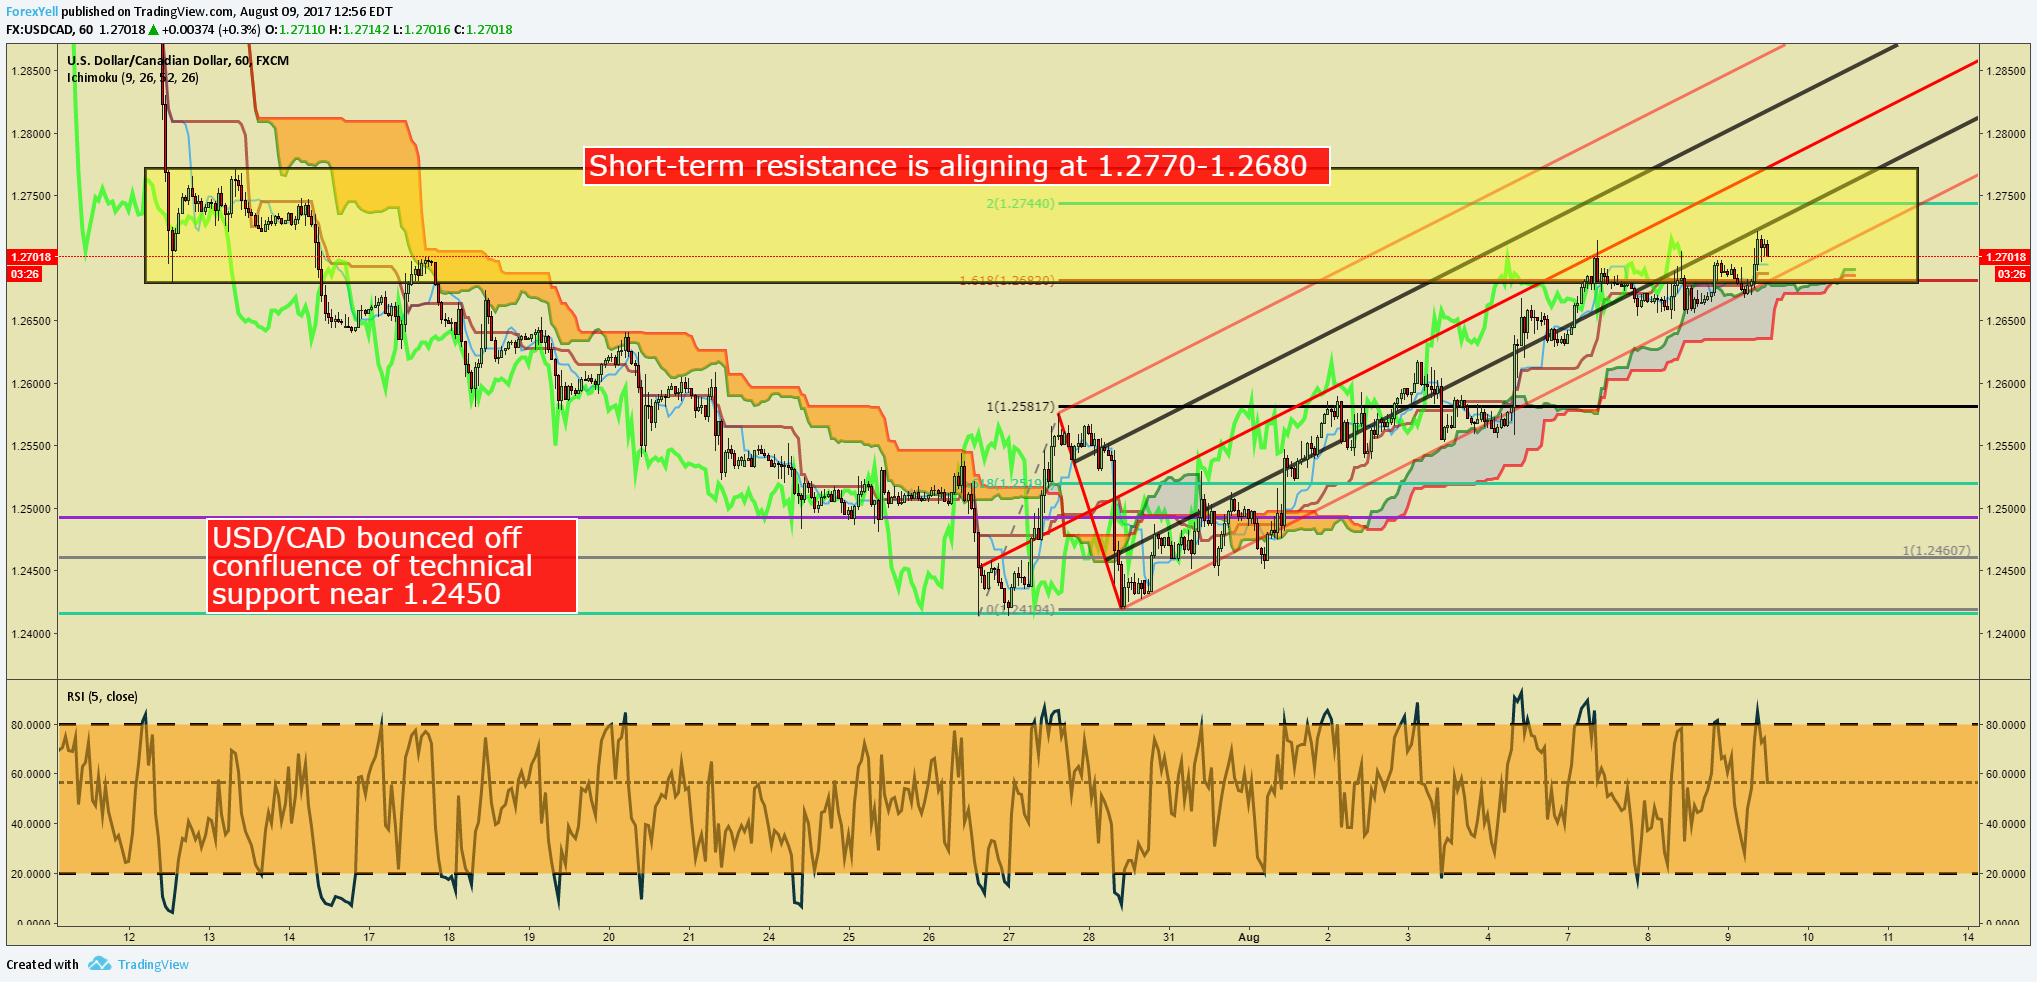
Chart Created by Tyler Yell, CMT
USD/CAD Insight from IG Client Positioning: 80% long exposure favors contrarian’s downside bias
The sentiment highlight section is designed to help you see how DailyFX utilizes the insights derived from IG Client Sentiment, and how client positioning can lead to trade ideas. If you have any questions on this indicator, you are welcome to reach out to the author of this article with questions at tyell@dailyfx.com.

USDCAD: Retail trader data shows 80.1% of traders are net-long with the ratio of traders long to short at 4.04 to 1. In fact, traders have remained net-long since Jun 07 when USDCAD traded near 1.34693; price has moved 5.6% lower since then. The number of traders net-long is 8.9% lower than yesterday and 2.6% higher from last week, while the number of traders net-short is 8.9% higher than yesterday and 13.7% lower from last week.
We typically take a contrarian view to crowd sentiment, and the fact traders are net-long suggests USDCAD prices may continue to fall. Positioning is less net-long than yesterday but more net-long from last week. The combination of current sentiment and recent changes gives us a further mixed USDCAD trading bias.(Emphasis mine)
---
Written by Tyler Yell, CMT, Currency Analyst & Trading Instructor for DailyFX.com
To receive Tyler's analysis directly via email, please SIGN UP HERE
Contact and discuss markets with Tyler on Twitter: @ForexYell


