


See How FXCM’s Live Clients Are Positioned in FX & Equities Here
Talking Points:
- USD/CAD Technical Strategy: Bears Be Warned, We’re on US Dollar Breakout Watch
- Trader Sentiment Warns a Coiled Move Lower or Higher Could Be Around the Corner
- USD/CAD Fell From 7-Week Lows on BoC Rate Announcement
Wednesday saw a move lower after the Bank of Canada kept rates unchanged. The Bank of Canada policy was balanced with encouraging marks as well, and disappointment spread throughout. Most notably for disappointment, the Alberta Wildfires are expected to cut 1.25 percentage points off Canada’s real GDP growth in Q2 2016 due to "fire-related destruction" and "associated halt to oil production." Additionally, there are increased vulnerabilities to Canadian Households, presumably similar to other Energy Reliance areas where leverage comes under scrutiny when revenue from resources dries up. Lastly, The Bank of Canada noted that business investment and intentions (commitments for future investment remain a disappointment.
Why then did the Canadian Dollar rise right after the report? First, there was a positive note regarding inflation that stated CPI inflation had risen recently; inflation is still slightly below the 2.0% target. Additionally, the Bank of Canada expects the economy to rebound in Q3 thanks to WTI Crude Oil price rebound should align with reconstruction in Alberta and production coming back online.
Therefore, it was a balanced statement, and for now, USD/CAD looks similarly balanced. In other words, while we’ve pushed into relative trend resistance via Ichimoku (explained below), there appears an Intermarket capability with WTI Crude Oil price steady near $50/bbl, and the US Dollar under strong resistance to pivot either way.
USD/CAD Has a Multitude of Strong Support at ~1.2750/1.2900 (H4 Chart)

Interested In Learning the Traits of FXCM’s Successful Traders? If So, Click Here
The chart above tells a story about what’s happened in USD/CAD from February to April, which was distinctly a mean-reversion in CAD & WTI Crude Oil and US Dollar Downtrend and the month of May. May provided a reversal of fortunes that had developed over the prior three months as the US Dollar began to rally, even as the hedge funds sold it as per the CFTC’s CoT report. Per the last report, the fight goes on as Hedge Funds and large speculators increased bets on Canadian dollar gains to the highest since 2013 earlier this month.
Either way, you’ll note that we’ve now seen a flip on the chart from bearish to bullish, at least on the H4 chart above. First, we’ve moved above the H4 Ichimoku Cloud and the 21-day moving average that currently sits below 1.2900. However, looking over the May Range, you can see the current May move from 1.2458-1.3188 or ~6% is now supported by the Fibonacci 38.2-61.8% retracement range. Given the change in central bank rhetoric and market pricing in of Fed Action, this short-term support should give hope for the Bulls who hope to go the distance to the mid-1.3000s and beyond.
Key Support Levels from Here (Visual Map Below)

Showcase your trading skills against your peers in FXCM's $10,000 Monthly Challenge with a Mini Account.
The daily chart above should help you get a sense for the divergence of long-term bearishness and swing-trader bullishness. Long-Term Resistance via the 100-DMA shown above at 1.3376 and the Ichimoku Cloud top near 1.3320 and the price channel ceiling are expected by the USD/CAD bears to hold price back. However, if it does not, there may be little that can hold the US Dollar and USD/CAD back from retracing much of the January 20-May 2 decline.
Shorter-term resistance is seen at the week’s high of 1.3180 and the pre-BoC high of 1.3140. A break above these levels, especially on a closing basis could show the previously mentioned resistance levels may soon be tested for significance.
Support, as noted above is easier to define on the swing chart. However, the Daily Chart provide 3-helpul levels to keep on watch. First, the May trend-line aligns nicely with the Weekly Pivot point at 1.3047. Within an ATR of .0097 is the Ichimoku Trigger Line (9-day midpoint or (high+ low for previous nine periods)/2) that stands at 1.3010.
Below here, we find a confluence of support between the 38.2-61.8% retracement of May’s 6% rally. Sticking with Ichimoku, the Base Line (26-day midpoint or (high + low for previous 26 periods)/2) current sits at 1.2823. Additionally, the Weekly S1 support aligns with the 38.2% retracement and May 18 open at 1.2908.
The steady-hand of the US Dollar and the lack of Canadian Dollar upside through May despite Oil’s rally would encourage me to look for a move to initial support at 1.3047/10 followed by 1.2908 as buying opportunities (not a trade recommendation).
Should one believe that the CAD is soon to return to its former glory displayed in February-April, weaker currencies that may trade well vs. the Canadian Dollar could be the Japanese Yen and the Euro, which have recently slide down the relative rankings at the end of May.
Canadian Dollar Has Lost Favor per Sentiment
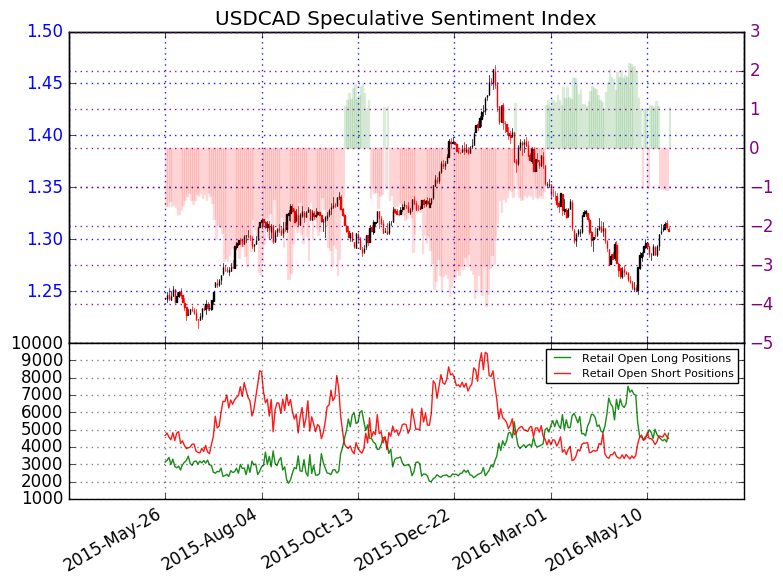
When looking at sentiment, crowd positioning has neutralized after a strong downtrend. For those familiar with our model, USD/CAD provided one of the strongest signals for downtrend continuation from late February to May. We use our Speculative Sentiment Index as a contrarian indicator to price action. Therefore, with that the majority of traders at a near net-flat bull: bear positioning of 1.06 as 51% of traders are long could be saying that we’re on the cusp of another big move even through the direction is less certain.
Short positions are 5.7% lower than yesterday and 3.8% below levels seen last week. We use our SSI as a contrarian indicator to price action, and the fact that the majority of traders are long gives a signal that the USDCAD may continue lower. The trading crowd has flipped from net-short to net-long from yesterday and last week. The combination of current sentiment and recent changes gives a further bearish trading bias.
USD/CAD Speculative Sentiment Index as of Wednesday, May 25, 2016
Combining the technical picture above, with the sentiment picture, and the Intermarket analysis support further warns of more CAD gains ahead against the US Dollar.
Key Levels as of Wednesday, May 25, 2016

T.Y.


