


USD Technical Outlook
- US Dollar Index (DXY) steadily trending lower towards yearly low
- Feb low up first at 89.68, then 89.20 to follow
US Dollar Technical Analysis: DXY Poised to Hit Yearly Lows or Worse
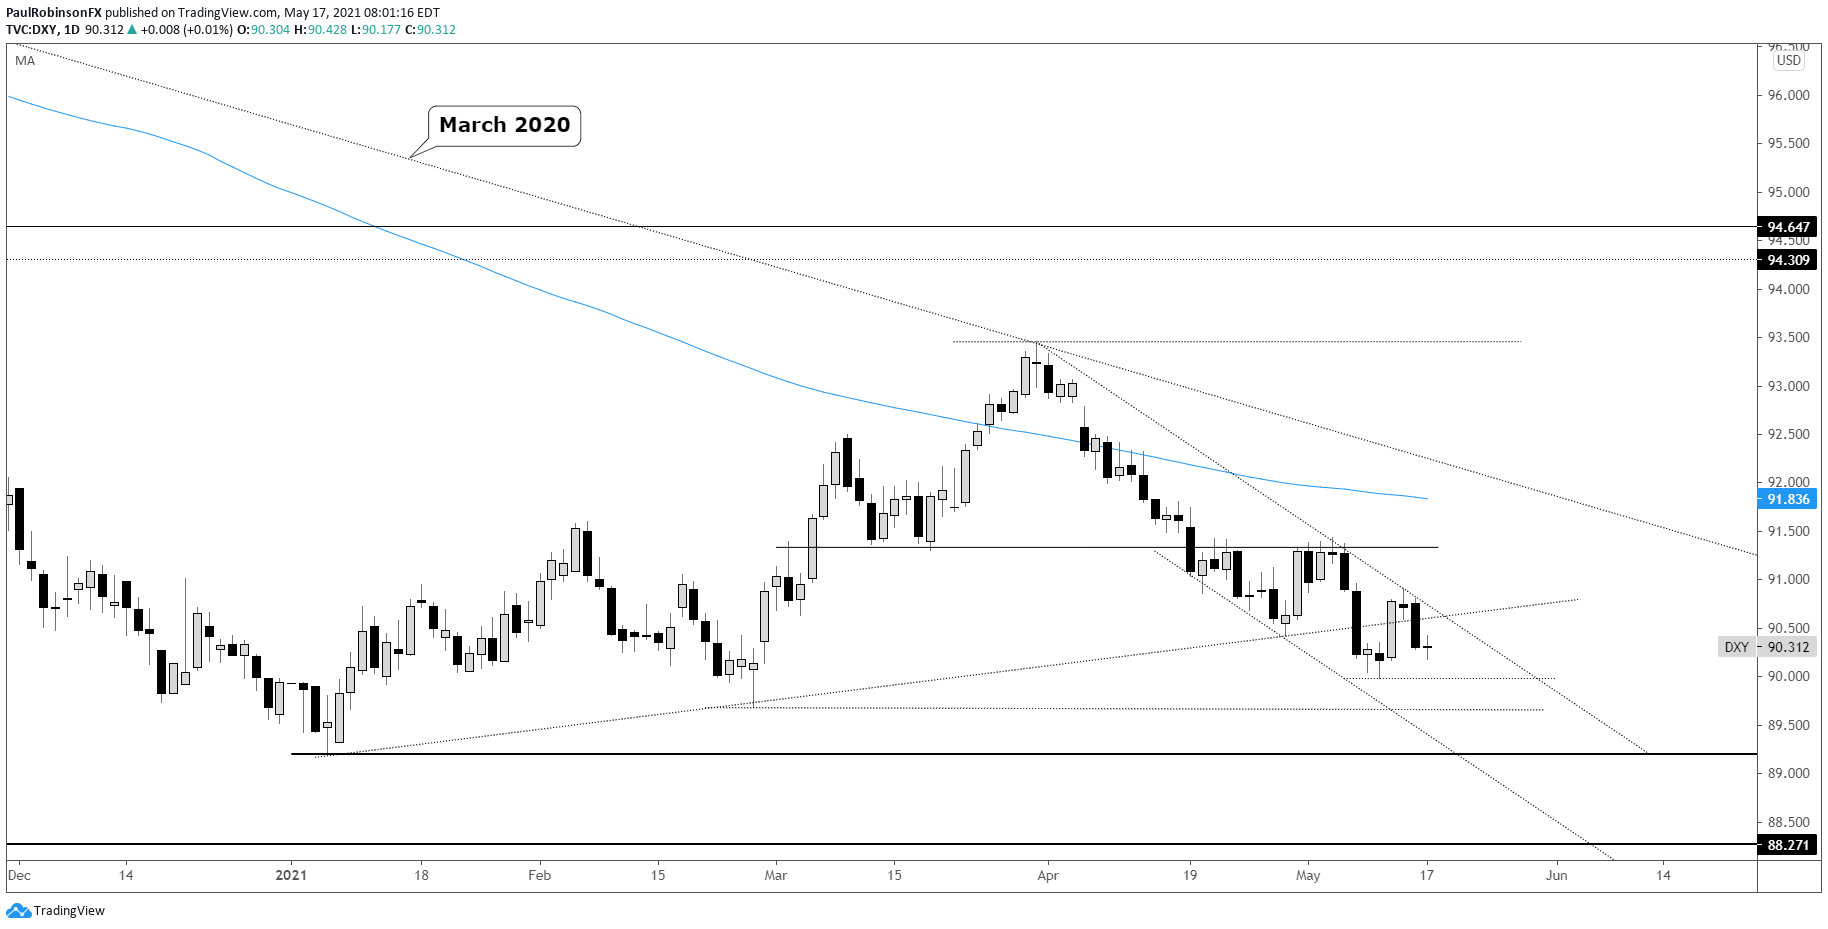
The US Dollar Index (DXY) continues to trade heavy, failing almost immediately to hold any sizable short-term pop it may have. Last week’s one day rally pushed it through the April low and just above the Jan-present trend-line, but brought into play trend-line resistance from the March high.
The turn down has a fresh low in sight beneath last week’s trough at 89.98. A breakdown below last week’s low will quickly have the February low at 89.68 up next as support, followed by the yearly low at 89.20.
The Feb low may help induce another bounce, but the anticipation is for it to be short-lived in-line with recent sequences. It could offer would-be shorts another opportunity to enter into short-term positions as the trend continues towards the yearly lows or worse.
The yearly low at 89.20 might be another story as far as meaningful support goes. It could be enough to induce a sizable reaction, even if that too is only short-lived. We of course need to wait for price to fall to that point, first, but something to keep in mind.
Flipping the script from bearish to bullish will require some work on the part of the dollar. For starters, a rally will need to last more than a day or two. The trend-line from April will first need to be broken, followed by climbing above a strong level of resistance right around the 91.40 level.
For shorts, the path of least resistance appears set to continue in their favor. For would-be longs, the picture holds little appeal in the absence of support in a steady downtrend.

US Dollar Index (DXY) Daily Chart (trending towards Feb & yearly lows)
Resources for Forex Traders
Whether you are a new or experienced trader, we have several resources available to help you; indicator for tracking trader sentiment, quarterly trading forecasts, analytical and educational webinars held daily, trading guides to help you improve trading performance, and one specifically for those who are new to forex.
---Written by Paul Robinson, Market Analyst
You can follow Paul on Twitter at @PaulRobinsonFX


