


Bitcoin Technical Price Outlook: BTC/USD Trade Levels
- Bitcoin updated technical trade level– Daily & Intraday Charts
- BTC/USD breakout falters at uptrend resistance- constructive while above 39430
- What is Bitcoin? Understand Bitcoin as a Cryptocurrency
Bitcoin prices are poised to snap a four-week winning streak with the cryptocurrency down more than 12% after reversing off confluence uptrend resistance into the start of the week. The move leaves BTC/USD vulnerable to further losses near-term with the broader outlook still constructive while within this technical formation. These are the updated targets and invalidation levels that matter on the BTC/USD price charts heading into the monthly open. Review my latest Strategy Webinar for an in-depth breakdown of this Bitcoin technical setupsand more.
Bitcoin Price Chart – BTC/USD Daily
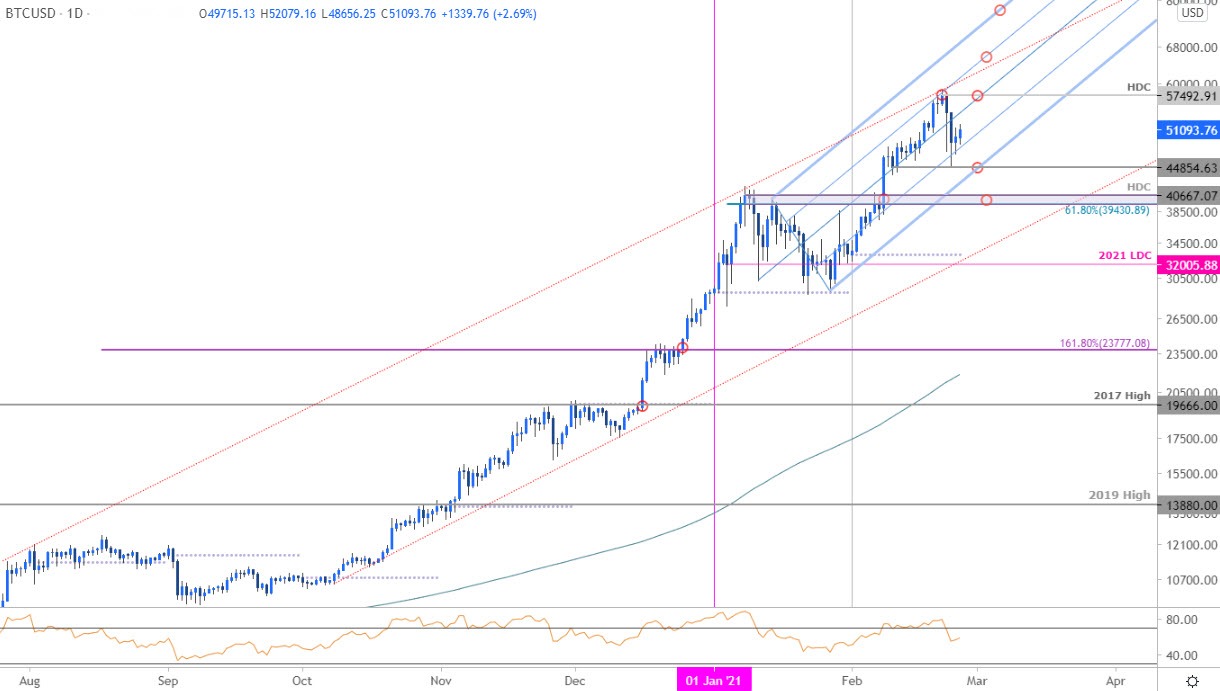
Chart Prepared by Michael Boutros (log scale), Technical Strategist; Bitcoin on Tradingview
Technical Outlook: Bitcoin prices surged more than 110% off the January lows before faltering with the rally turning at confluent trendline resistance (high registered at 58354). The subsequent breakdown fell more than 23% off the highs with daily momentum closing below overbought territory for the first time since February 8th.
Initial support rests with the lower parallel / 2/10 reversal close near 44854 with broader bullish invalidation now raise raised to the 61.8% Fibonacci retracement of the year-to-date 2021 range / January high-day close at 39430-40667. Ultimately a breach / close above the record high-day close at 57492 is needed to mark resumption with such a scenario eyeing the upper parallels, currently around ~65000.
Bitcoin Price Chart – BTC/USD 240min
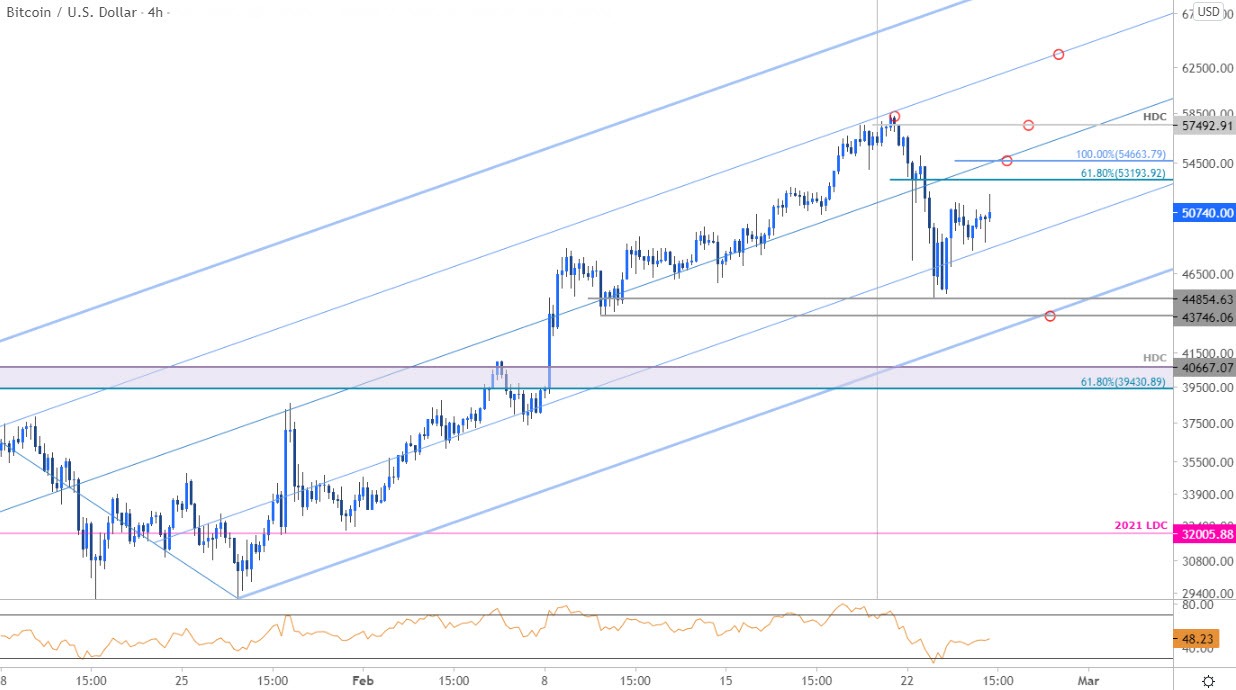
Notes: A closer look at Bitcoin price action shows BTC/USD trading within the confines of an ascending pitchfork formation extending off the late-January lows with price failing at the 75% parallel into the start of the week. Initial resistance eyed at the 61.8% retracement at 53193 backed closely by the 100% extension at 54663- look for topside exhaustion ahead of this zone IF price is going to correct lower.

Bottom line: A pullback off confluence uptrend support threatens a larger pullback here but keeps the broader trade constructive while within this formation. The RSI signature suggests we may be in for a period of chop here in the days ahead - stay nimble into the monthly close here. From a trading standpoint, a good zone to raise protective stops – be o the lookout for topside exhaustion ahead of the high-day close IF price is head lower. Ultimately a larger pullback may offer more favorable entries closer to uptrend support.
For a complete breakdown of Michael’s trading strategy, review his Foundations of Technical Analysis series on Building a Trading Strategy
---
Active Technical Setups
- Gold Price Outlook: Gold Recovery First Test at Trend Resistance
- Canadian Dollar Outlook: USD/CAD Threatens Major Breakdown
- Sterling Outlook: GBP/USD Breakout Extends to First Resistance Hurdle
- Australian Dollar Outlook: Aussie Rally Rips to Resistance
- Euro Outlook: EUR/USD Plummets Past 1.20- 2021 Breakdown Intensifies
- Written by Michael Boutros, Currency Strategist with DailyFX
Follow Michael on Twitter @MBForex


