


U.S. Indices Technical Outlook:
- S&P 500 came out of the low with a lot of momentum
- Yesterday’s sell-off is putting the recovery idea to the test
- RST bottoming pattern still remains in play
S&P 500 Outlook: Needs to Hold Here for Outlook to Remain Positive
Recently, I have been discussing the potential for the S&P 500 to undergo a recovery in a broader bear market trend. A bounce that could extend the next few weeks, a ‘summer rally’ if you will. The thinking wasn’t based on the seasonal bias, but rather a technical pattern developing in recent weeks.
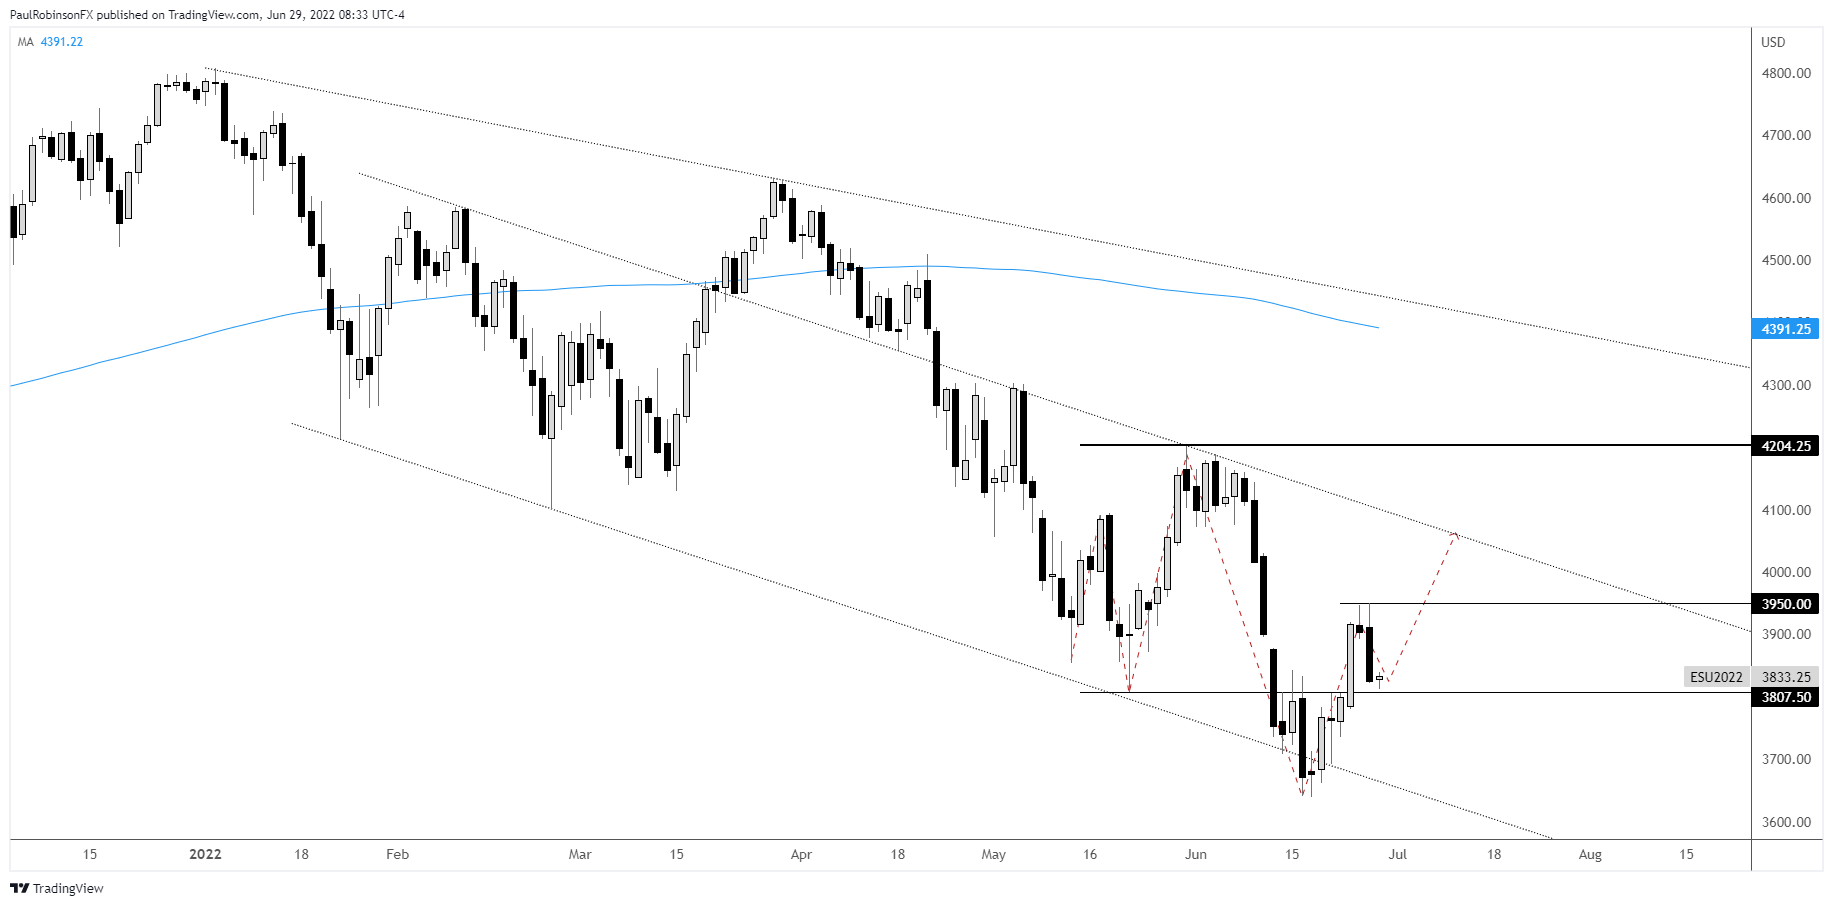
Following the FOMC meeting when the Fed raised rates by 75 bps, its largest increase since 1994, we saw a low put in that brought into play the ‘RST’ pattern that has been developing since May. These patterns are highlighted (in this case because it is bullish) by lower lows and higher highs.
The Reverse Symmetrical Triangle marks growing indecision by the market, evidenced by the increasingly larger price swings, that can lead to a trend change or countertrend move at the least. The pattern triggered last week when the ES closed the day (& week) above 3807.50 by trading above the second low of the pattern created on May 20.
The first test of this pattern has arrived as the market trades back down towards support. It will be very important to see the market turn around from around the 3807.50 level. We could see a bit of a dip below that level, but losses will need to be quickly erased.
The first dip after an RST trigger creates a near-term high, in this case yesterday’s high at 3950. If the market can turn around and the S&P can cross 3950 a successful test of the pattern will be in and higher levels can come into play.
If we see this occur, look first to resistance via a slope from February that currently clocks in around 4050. From there the top of the pattern just over 4200 will be the next target. A rise beyond 4200 will likely prove difficult within the context of a broader bear market, and will be viewed as a potentially good spot to look to place bearish wagers.
On the downside, if we see the market continue yesterday’s weakness and head towards the recent lows, the bullish bias of the RST pattern will quickly diminish and a flipping of the trading bias may be warranted.
S&P 500 Daily Chart
Resources for Forex Traders
Whether you are a new or experienced trader, we have several resources available to help you; indicator for tracking trader sentiment, quarterly trading forecasts, analytical and educational webinars held daily, trading guides to help you improve trading performance, and one specifically for those who are new to forex.
---Written by Paul Robinson, Market Analyst
You can follow Paul on Twitter at @PaulRobinsonFX


