


S&P 500/Dow Highlights:
- S&P 500 has support just below, but break and a big test could be on its way
- Dow Jones closes down for 8th consecutive day, has 200-day coming up
For longer-term trading ideas, forecasts, and a library of educational content, check out the DailyFX Trading Guides.
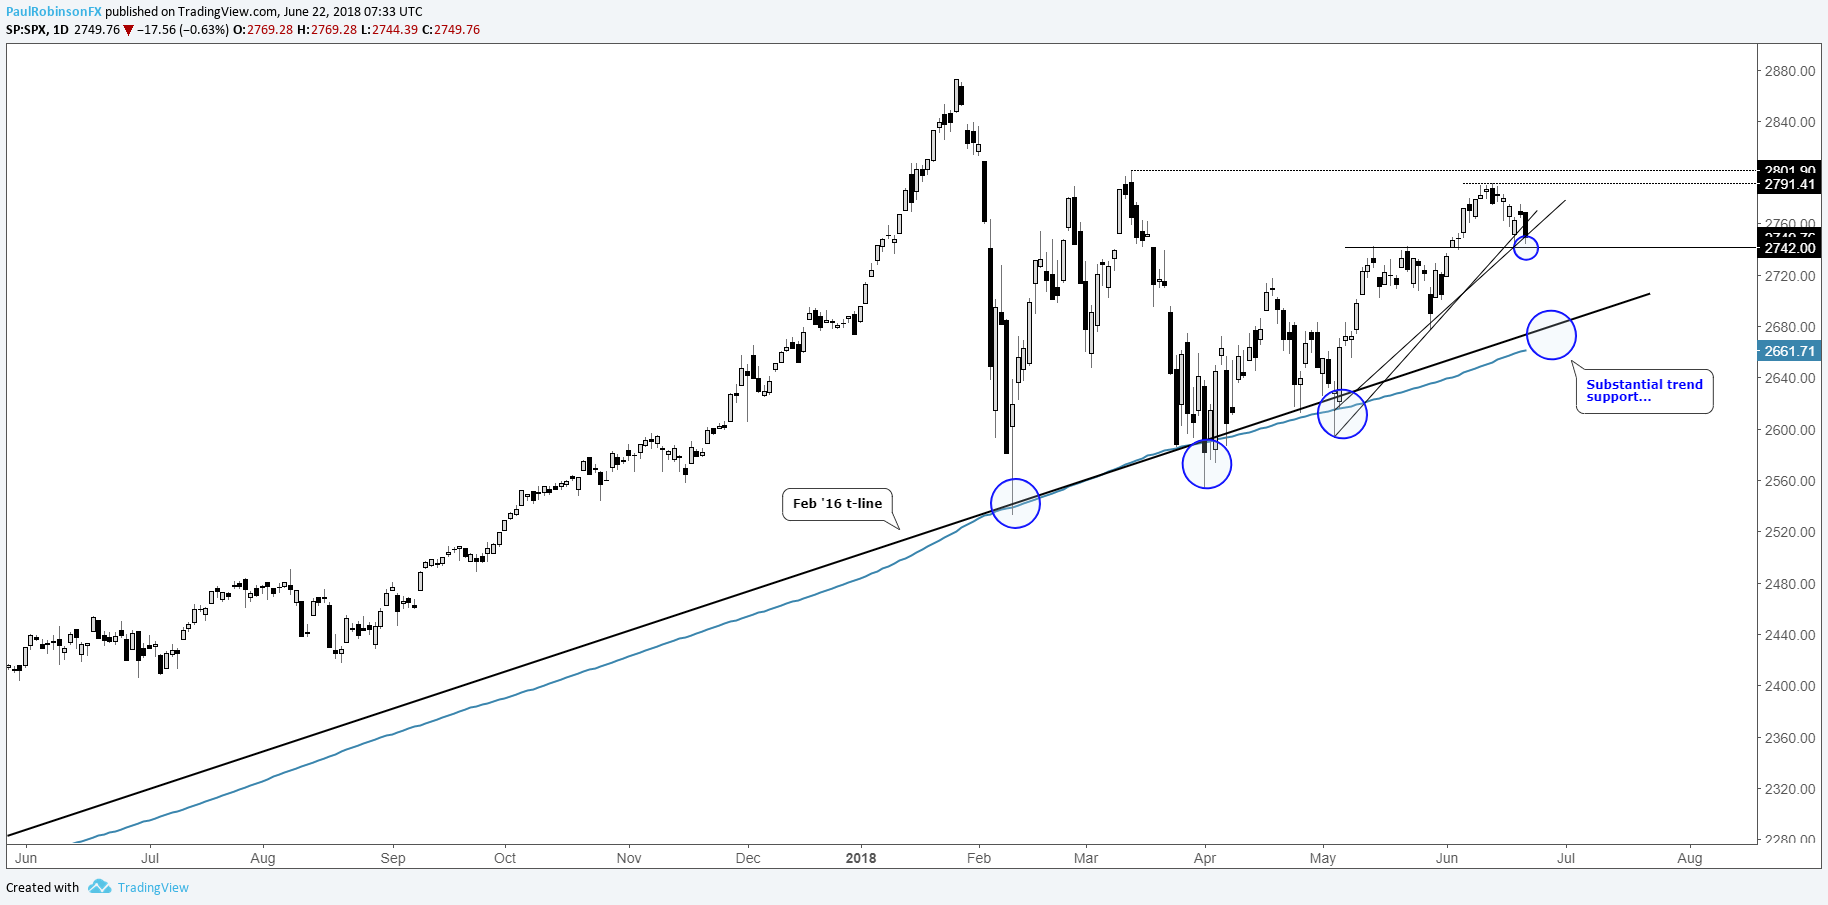
S&P 500 has support just below, but break and a big test could be on its way
Yesterday’s decline in the S&P 500 put it one step closer towards a very important test should it fail to hold above a pair of swing highs carved out last month around the 2742 mark. There is also trend-line support in the current vicinity depending on how you draw the line. In one instance it’s broken, but using a more conservative approach it has yet to break – we’ll give the final angle the benefit of the doubt to play it safe.
In any event, a break below the aforementioned May highs will have the trend-lines broken regardless of how one draws them. After a wobbly sequence of overlapping price action since the March low, a more sustainable down-move could soon come to roost.
This would have the very important February 2016 trend-line/200-day combination back in play once again. It’s held the market up on three prior occasions, but can it do it for a fourth time? A breakdown below this powerful bull-market threshold could spell big trouble for the market as the summer heats up.
A hold, though, right here can stave off those thoughts for another day and possibly etch out yet another higher low without having breached support levels. Things could start to get very interesting here, or perhaps price action simmers back down and we get a choppy summer trading environment.
Check out this guide for 4 ideas for Building Confidence in Trading
S&P 500 Daily Chart (Watch nearby support)
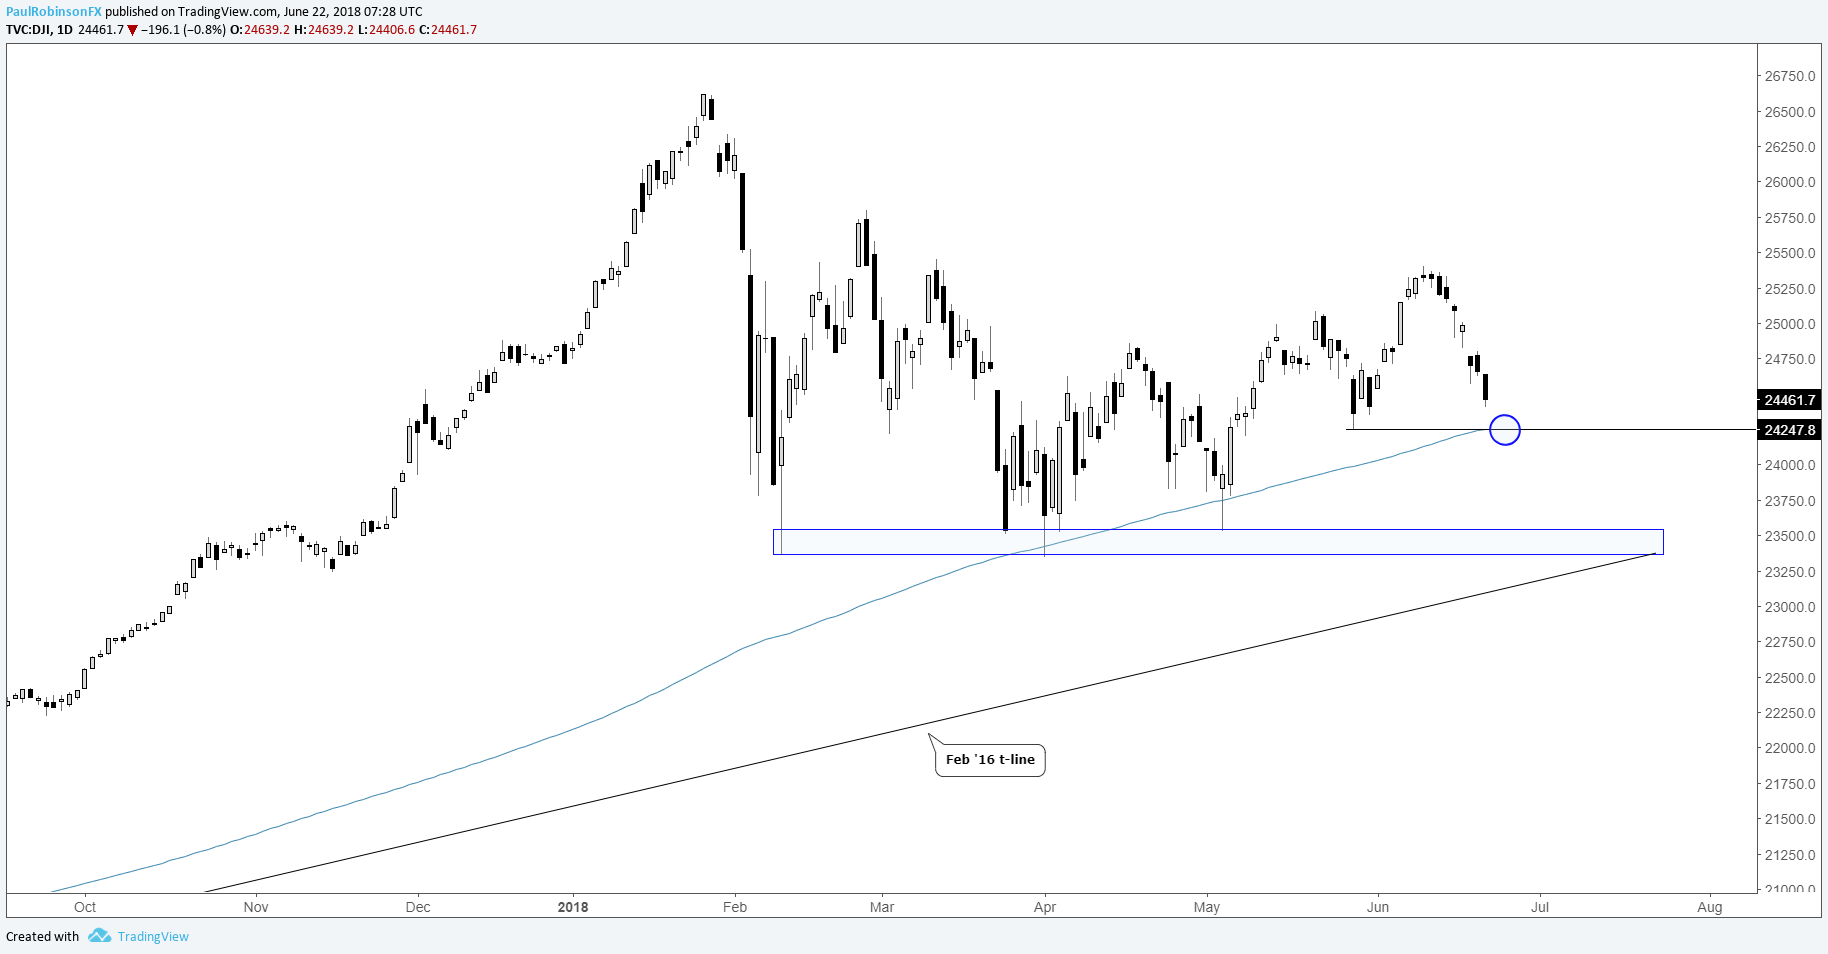
Dow Jones closes down for 8th consecutive day, has 200-day coming up
The Dow posted its 8th consecutive down day yesterday, and according to Chief Strategist, John Kicklighter, that matches the longest streak since February 1984. The streak has the 200-day squarely in sight at 24254, which also matches up very closely to the low of the last pullback in late-May.
A bounce on first arrival seems likely, but should that be all it is proven to be, a seller’s bounce, a decline down into the mid-23000s would make for a very interesting big-picture test in conjunction with the S&P pressing down on its own major threshold.
Dow Daily Chart (200-day just below)
If you’d like to listen in on live technical analysis on global equity indices (and commodities), join me every Tuesday at 9 GMT time.
Resources for Forex & CFD Traders
Whether you are a new or experienced trader, we have several resources available to help you; indicator for tracking trader sentiment, quarterly trading forecasts, analytical and educational webinars held daily, trading guides to help you improve trading performance, and one specifically for those who are new to forex.
---Written by Paul Robinson, Market Analyst
You can follow Paul on Twitter at @PaulRobinsonFX


