


What’s inside:
- S&P 500 pulling back off a top-side slope resistance
- Seasonality and overall trend remain favorable
- A higher-low may offer one more ‘buy-the-dip’ for this year
See how traders are positioned in the S&P 500 and other markets on the IG Client Sentiment page.
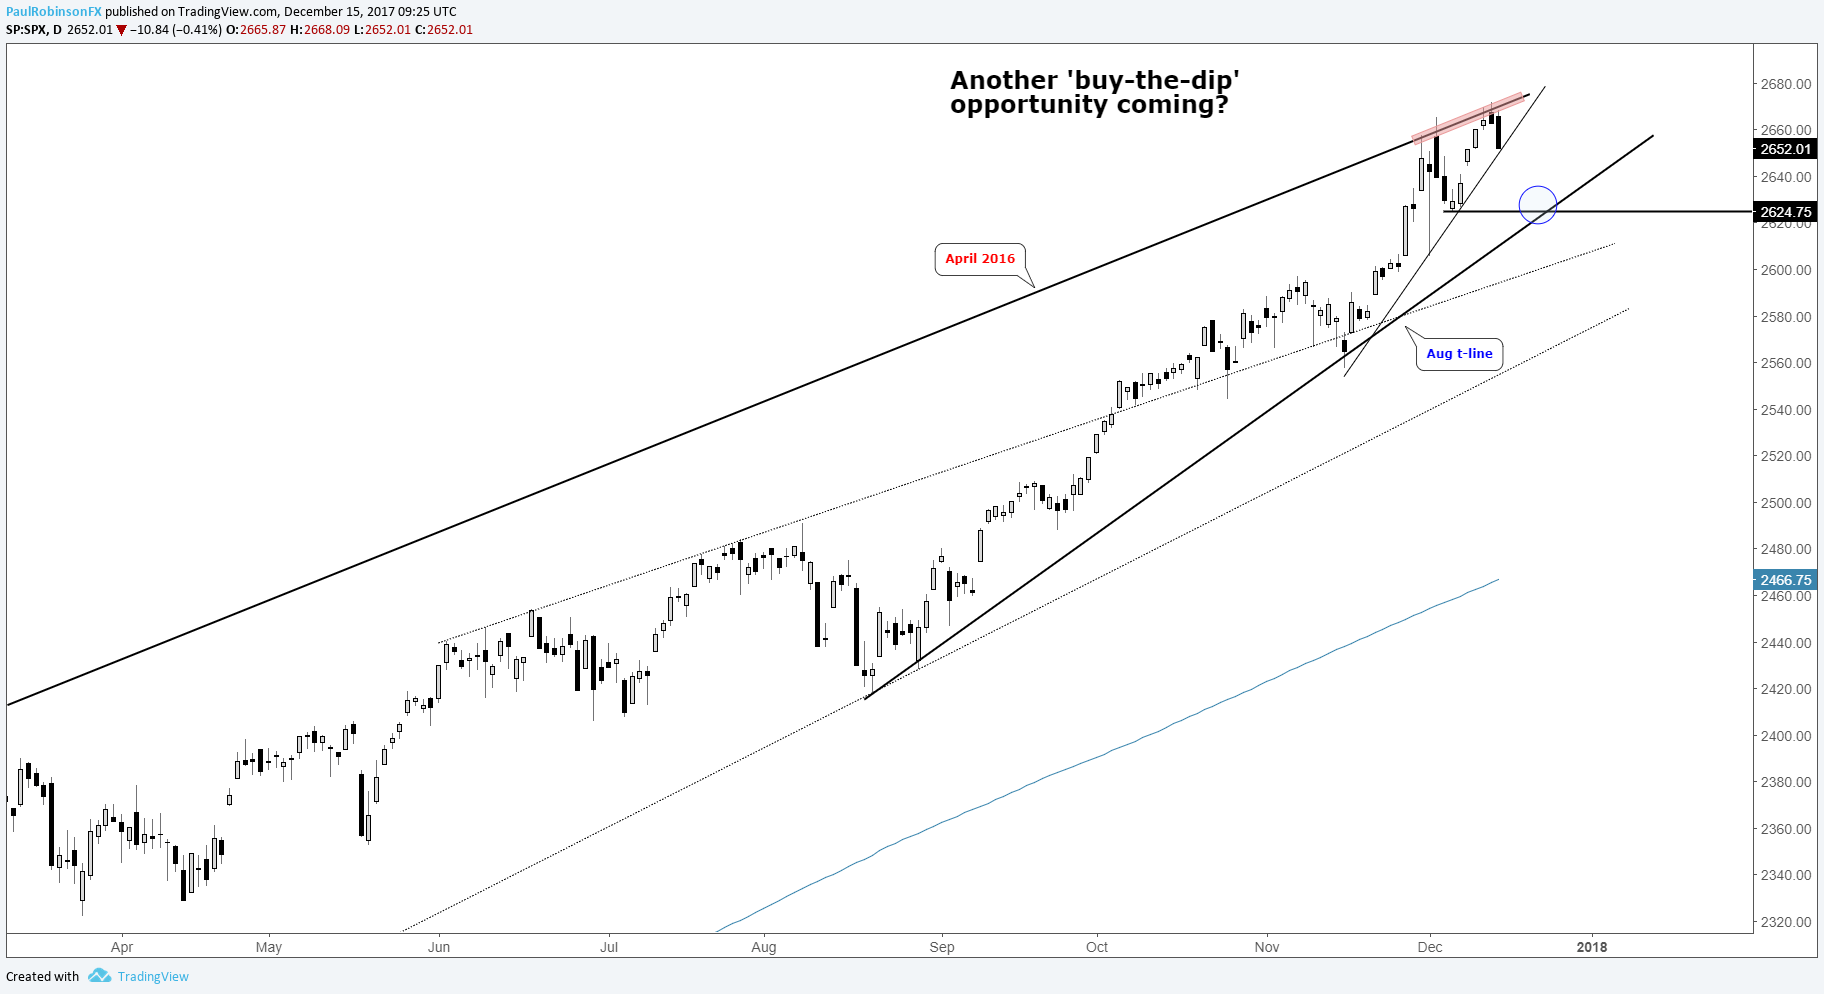
Yesterday, the S&P 500 declined off the top-side slope extending over from a peak created in April 2016. It’s the same slope the market experienced a gap reversal off of on 12/4. At that time, the S&P looked poised to start rolling downhill towards support around 2600, but as has been the case during this latest run the dip was quickly bought.
Will buyers snatch up stocks so quickly on weakness this time around? Recent history says, yes, that in all likelihood we will see a dip bought, and probably sooner rather than later. The trend is up and seasonality is favorable, so it’s hard to argue against the case that mild weakness won’t end up as another ‘buy-the-dip’ opportunity.
Yesterday, the cash index closed the session on the trend-line running higher from the November low. It’s not a major trend-line, so if it breaks it won’t be considered anything alarming, but may give the S&P a bit more of a nudge lower. The most recent pullback low at 2624.75 is unlikely to be exceeded if the market is to offer traders one more shot at new highs before the year concludes. Depending on the timing that level could also be in confluence with the trend-line dating back to August, which would add more weight to its importance.
The sequence has been pretty clear the past few months, with higher-highs and higher-lows marking a strong trend. In the event that market halts its decline ahead of that key low and turns higher, creating another higher-low, it will be viewed as a positive and eyes will turn back towards the April 2016 top-side slope and new record highs. On the flip-side, if we see selling accelerate and 2624.75 is snapped, then we may be in for a larger decline back towards support around 2600.
Start expanding your knowledge base today – Market Forecasts and Educational Guides
S&P 500: Daily
---Written by Paul Robinson, Market Analyst
To receive Paul’s analysis directly via email – SIGN UP HERE
You can follow Paul on Twitter at @PaulRobinsonFX


