


What’s inside:
- S&P 500 continues to forge on to new heights, taking out eyed top-side trend-lines
- Looking to those trend-lines as potential support on pullback/consolidation
- Sharp turn in momentum as seen at other short-term tops needed before turning bearish
Find out what is expected to drive markets into year-end in the DailyFX Quarterly Forecasts.
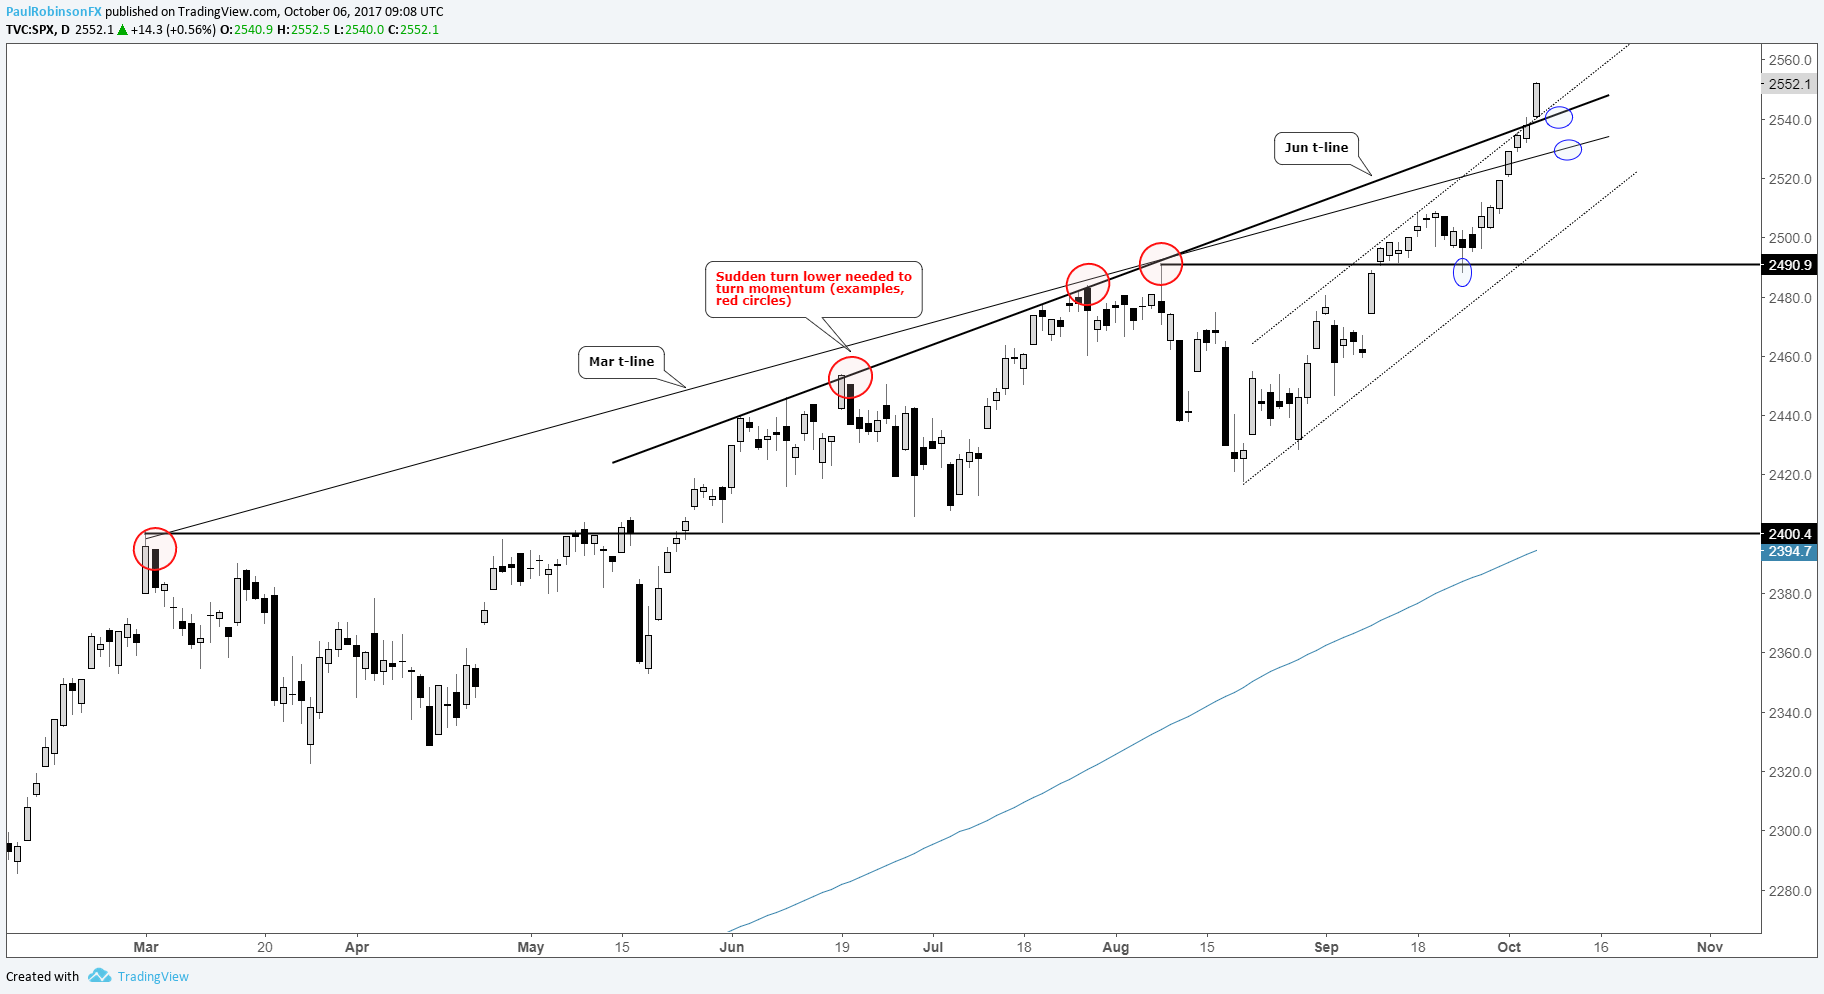
The last time we looked at the S&P 500 we were constructive on the index following the quick decline and hold of the prior record high in August. Looking higher our eyes were set on a pair of top-side trend-lines, one extending off the March high and the other over tops starting back in June. Neither of those trend-lines provided resistance as the market powered higher. Price action at both lines showed no signs of momentum slowing and thus kept longs firmly in the game. Caution was warranted on approach, but no cues were given that the market wanted to abide by those resistance levels and reverse.
The market is extended, but extended can become more extended and this makes shorts still unappealing, especially with no resistance in the vicinity. Tactically, it’s a difficult spot for traders. Chasing momentum can be a dangerous endeavor, but shorting momentum without a signal that the market wants to find some type of short-term type is also dangerous.
So, what is a trader to do? If holding no position, patience here is required until a good risk/reward set-up appears. On a pullback/consolidation watch how the market treats the recently broken top-side trend-lines, especially the June line. If it can hold as support then there may be an opportunity for would-be longs to join in on further upward momentum. If we see a sharp reversal or engulfing bar as we saw in March, June, and August then we may have at least found a short-term top and shorts could then gain the upper hand while the market goes through another mild corrective period.
Volatility alert: Later this morning at 12:30 GMT time, we have the U.S. jobs report. For live coverage join in on the NFP Roundtable discussion with our analysts, coverage beginning at 12:15.
Paul conducts webinars Tuesday-Friday. See the Webinar Calendar for details, and the full line-up of upcoming live events.
S&P 500: Daily
---Written by Paul Robinson, Market Analyst
You can receive Paul’s analysis directly via email by signing up here.
You can follow Paul on Twitter at @PaulRobinonFX.


