


To receive James Stanley’s Analysis directly via email, please sign up here.
Talking Points:
- GBP/USD Technical Strategy: Flat.
- The Cable continues to trade higher as Brexit risks/fears appear to be getting priced-out of the market.
- If you’re looking for more trade ideas, check out our Trading Guides; they’re free.
In our last article, we looked at the vertical-like price movements being seen in the Cable as the up-trend continued to take further hold. As we had written, traders would likely want to wait for price to move down to support before looking to get long, as the fear of chasing new highs turned out to be well-founded as the pair turned lower shortly thereafter. Price action on Friday of last week, leading into Monday and then Tuesday of this week produced a morning star formation with support right off of the 38.2% retracement of the prior major move at 1.4443, and this ‘higher-low’ further confirms the up-trend in GBP/USD.
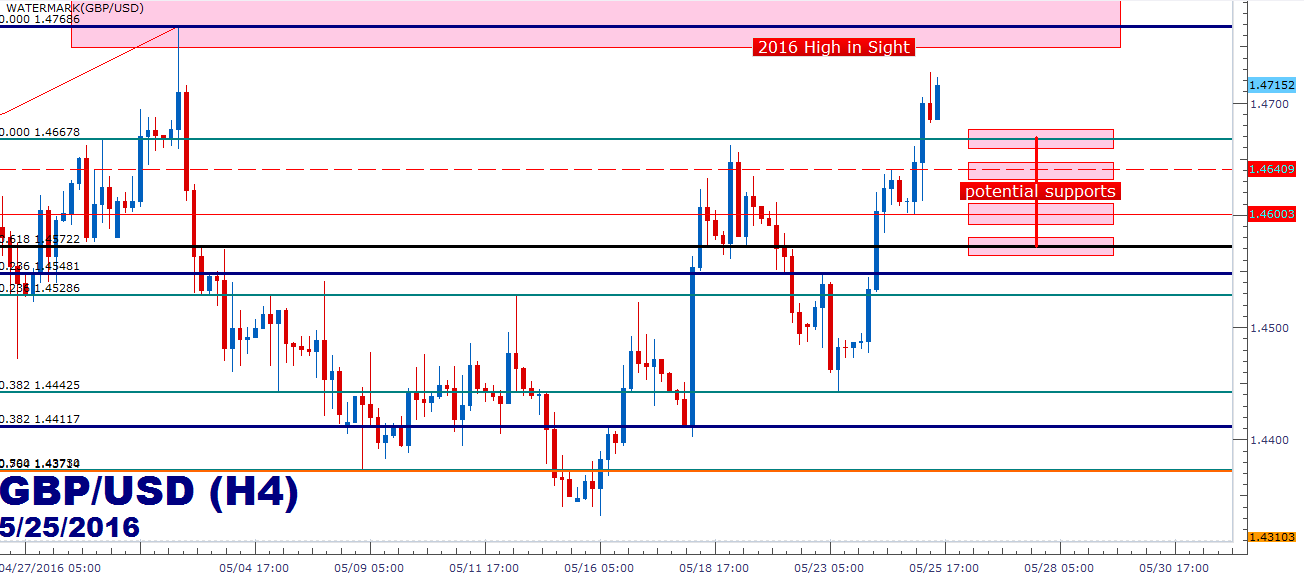
At this stage, the Cable is but 55 pips away from the 2016 high, and this could make profit targets for long positions unattractive given that the most recent swing-low on the daily chart is more than 260 pips away from current price action.
Traders looking to trigger long can look for price to move to support before triggering top-side positions. There are four support levels nearby and underneath price action that may come into play for such a strategy. In the 1.4668 vicinity, we have the February top in the pair, and this had also furnished support after GBP/USD ran to new highs in early May. At 1.4640, we have the prior swing high, and this was a very short-term inflection, so traders would likely want to confirm support before acting off of such a level so near to current price action. At 1.4600 we have the previous swing-low, and at 1.4572 we have the 61.8% retracement of the ‘big picture’ move in GBP/USD, taking the low of 1.0500 up to the 2007 high of 2.1160.
Each of these levels could be potential ‘higher-lows’ for those looking to get long on the prospect of continued Sterling-bullishness. If price action falls below the prior ‘higher-low’ at 1.4443, the bigger picture up-trend in GBP/USD comes into question; and this could be an operable level for traders to investigate stop placement for long positions.
Created with Marketscope/Trading Station II; prepared by James Stanley
--- Written by James Stanley, Analyst for DailyFX.com
To receive James Stanley’s analysis directly via email, please SIGN UP HERE
Contact and follow James on Twitter: @JStanleyFX


