


Talking Points
- CAC 40 stocks trade lower as European shares decline
- CAC 40 prices have broken short-term support near 4,400
- If you are looking for more trading ideas for equities markets, check out our Trading Guides
European stocks are set to close the week trading lower, with the CAC 40 trading down -1.88% on the day. This move has been accounted for as a flight to safety, as equities investors have taken money out of stocks and placed them in traditional safe haven assets such as corporate bonds. Of its 40 listed components, AXA croup is leading the CAC 40’s decline, and is currently trading down 4.13%.
CAC 40 Daily Chart
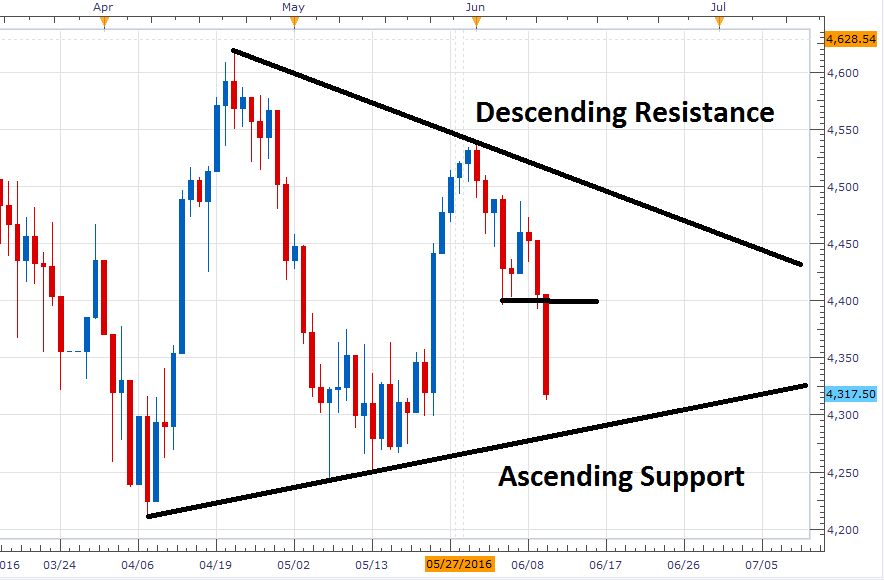
(Created using Marketscope 2.0 Charts)
Technically, the CAC 40 continues to trade in the previously described symmetrical triangle. However, with the Index declining this morning, price action has now traded through short-term support, which was found at the psychological 4,400 value. If prices continue to decline, traders may look for support near 4,300. If prices hold at trendline support, traders may begin looking for a bounce in price back towards resistance near 4,450. Alternatively, if prices breakout lower, traders may look for support at the next swing low at 4,244. A move to this value would be significant as it would suggest a change in the current market conditions, and suggest a resumption of the CAC 40’s daily downtrend.

Find out real time sentiment data with the DailyFX’s sentiment page.
As prices have declined, SSI (speculative sentiment index) for the CAC 40 (Ticker: FRA40) continues to rise higher. In our last updated SSI was reading at +2.20. Now after today’s decline SSI is standing at +3.37 with 77% of open interest long. This extreme net long positioning suggests that prices may continue to trade lower. Alternatively, in the event of a bullish breakout, SSI would be expected to flip net negative as prices advance.
To Receive Walkers’ analysis directly via email, please SIGN UP HERE
See Walker’s most recent articles at his Bio Page.
Contact and Follow Walker on Twitter @WEnglandFX.


