


EUR and USD Price Outlook
- EUR/JPY and USD/JPY Charts and Analysis
- Euro and US Dollar price action against Japanese Yen.
See Our latest trading guides for free and discover what is likely to move the markets through Q3 of this year.
Euro and US Dollar continue Softening against Japanese Yen
Last week EUR/JPY declined to 118.26 - its lowest level in 28 months. The pair closed the weekly candlestick with rough 2.1% loss. Similarly, USD/JPY fell to 106.50 its lowest levels in seven months, then closed on Friday losing near 1.9% of its value. Today, US Dollar has kept falling against Japanese Yen as discussed in last update: How USD/JPY may keep falling
On Thursday, the Relative Strength Index (RSI) dipped below 30 on EUR/JPY then remained moving in the oversold territory, reflecting the strength of the downtrend momentum at this stage. Additionally, the oscillator fell sharply on USD/JPY and crossed below 50 indicating to the start of a bearish move.
Having trouble with your trading strategy? Need a hand? Here’s the #1 Mistake That Traders Make
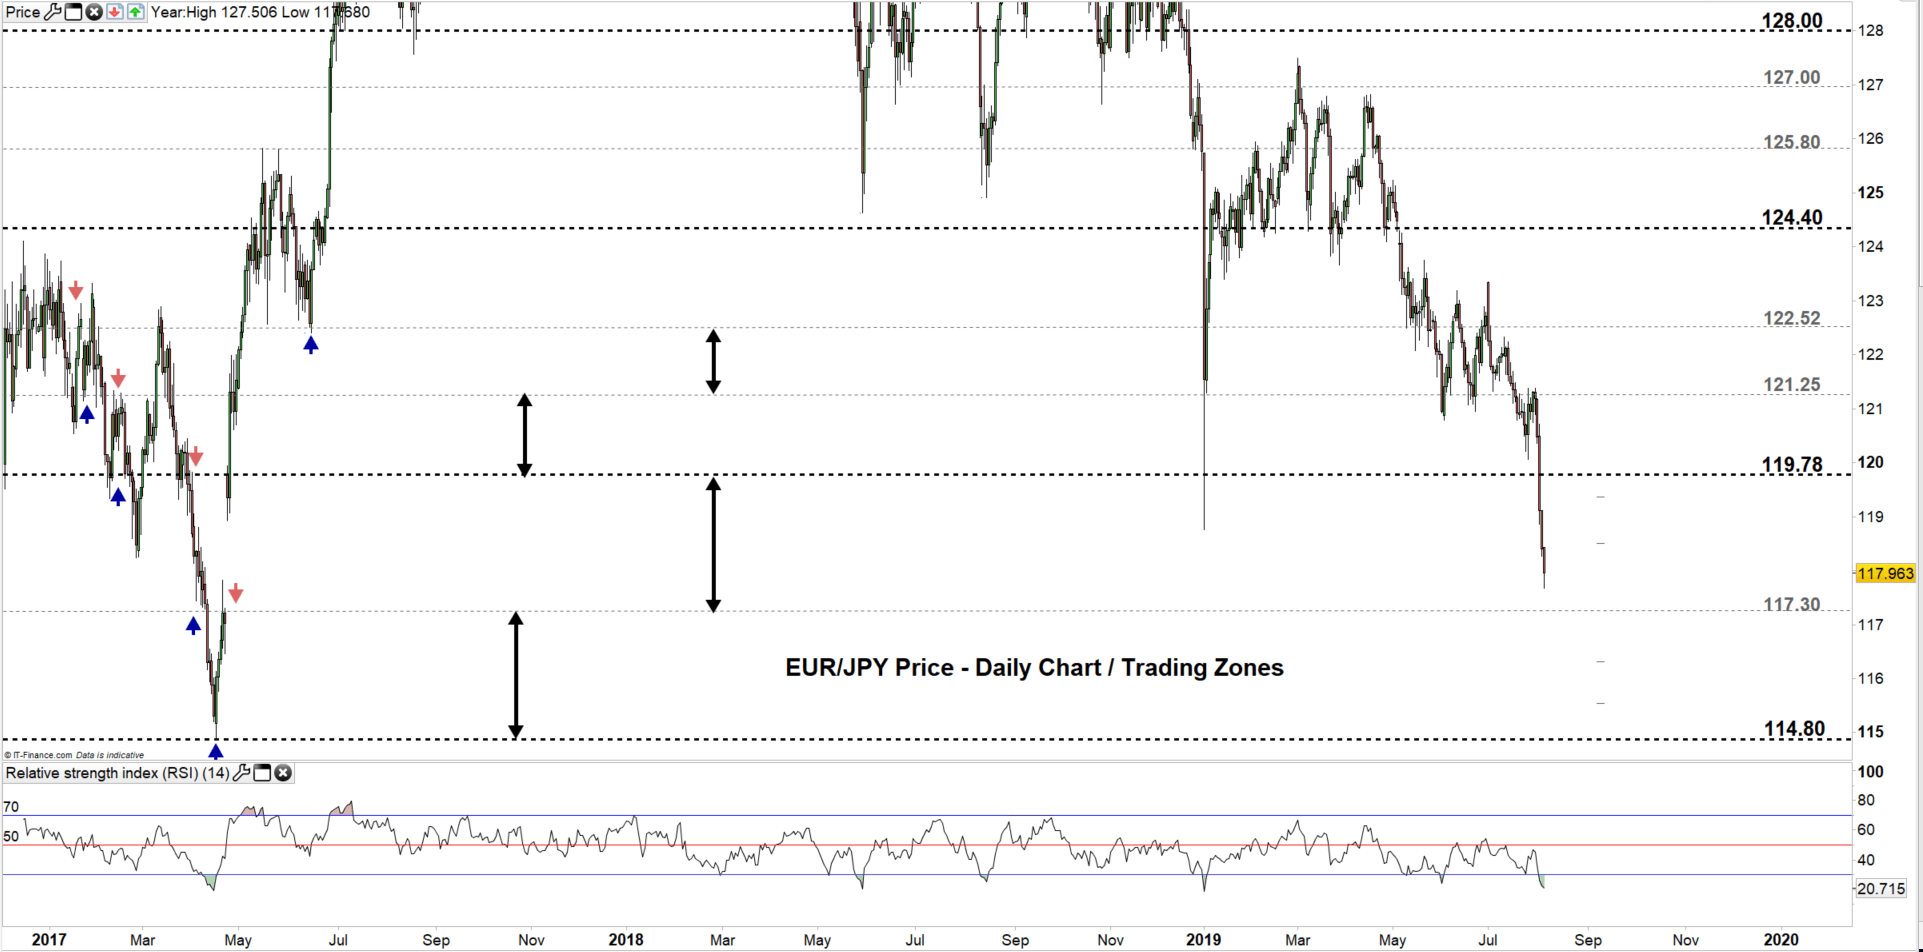
EUR/JPY DAILY PRICE CHART (DEC 15, 2016 - AUG 5, 2019) Zoomed Out
EUR/JPY DAILY PRICE CHART (MAy 1 - AUG 5, 2019) Zoomed in
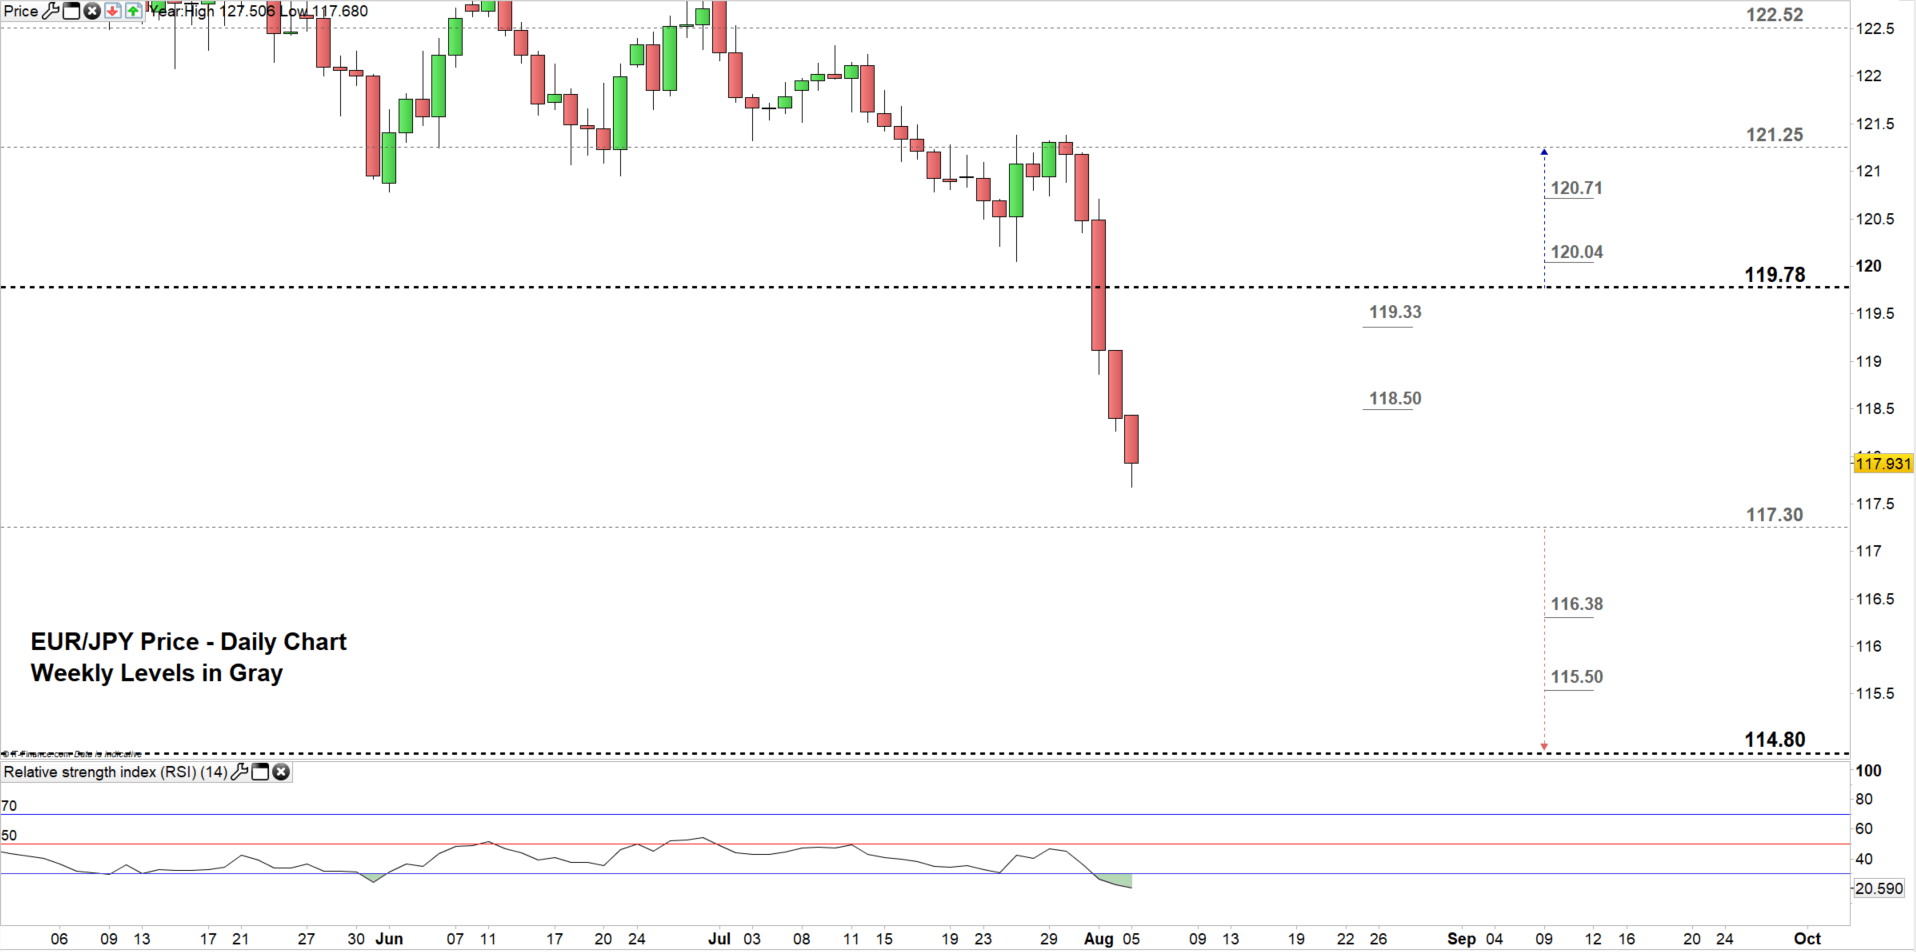
Looking at the daily chart we notice on Thursday, EUR/JPY fell to the lower trading zone 117.30 – 119.78. The pair may test this week the low end of this zone. Hence, a close below the low end may press the price towards 114.80. Nonetheless, the weekly support levels underscored on the chart (zoomed in) need to be watched closely.
On the flipside, any failure to close below the low end of this trading zone, could reverse the pair’s direction pushing the price towards the high end of the zone. Further close above the high end may cause more bullishness towards 121.25. However, the weekly resistance levels underlined on the chart would be worth monitoring.
Just getting started? See our Beginners’ Guide for FX traders
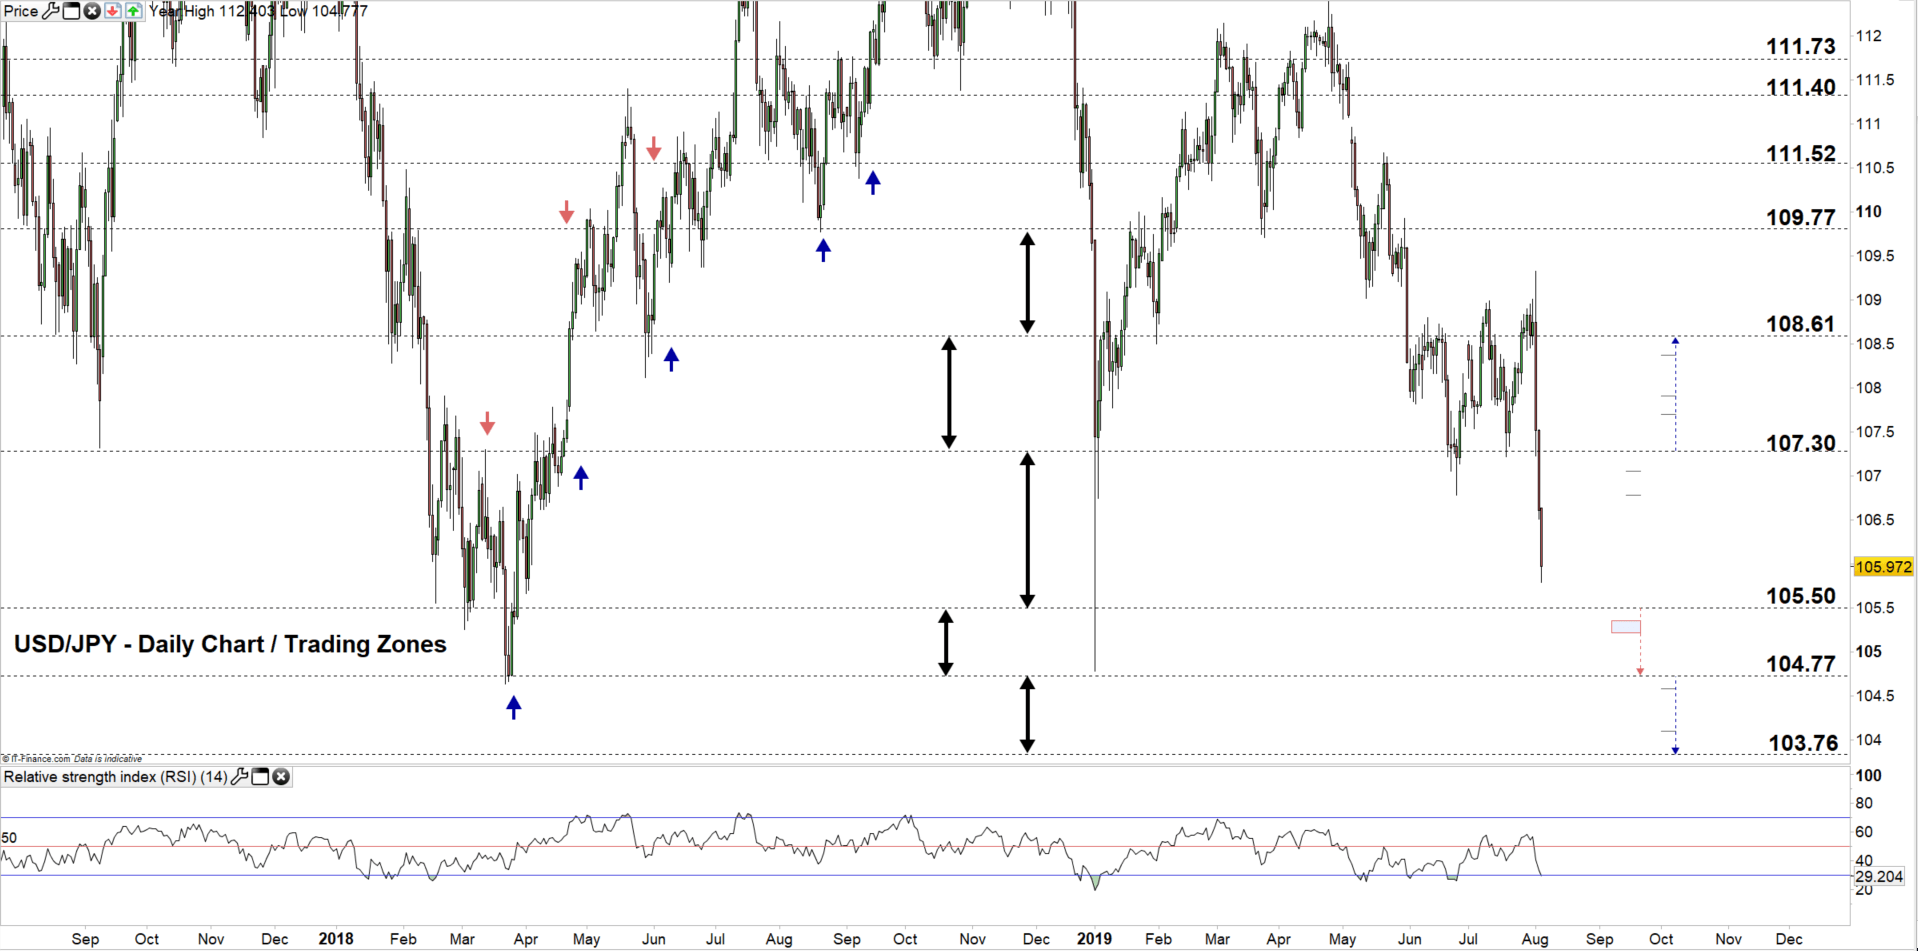
USD/JPY Daily CHART (JULY 18, 2018– AUG 5, 2019) Zoomed Out
USD/JPY Daily CHART (MAy 8 – AUG 5, 2019) Zoomed In
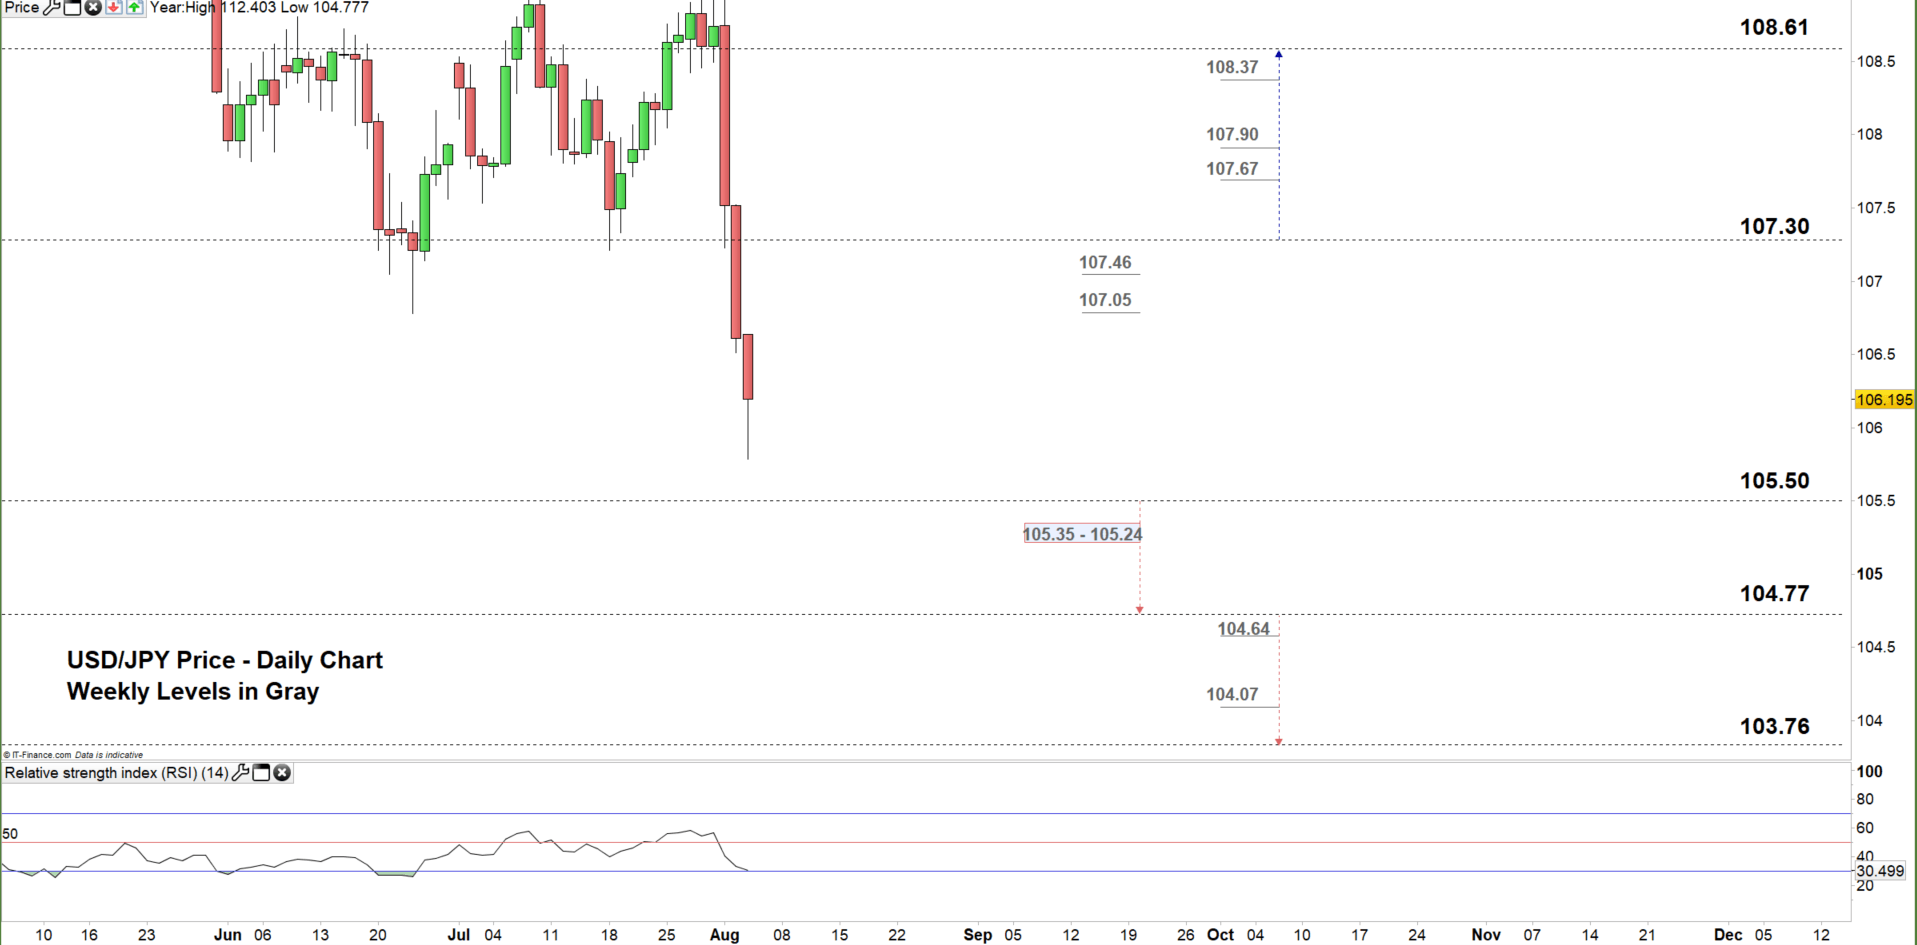
Looking at the daily chart we notice on Friday, USD/JPY moved to the lower trading zone 105.50 – 107.30 eyeing a test of the low end. Therefore, a close below the low end of this zone could mean more bearishness towards 104.77. Although, the weekly support area highlighted on the chart (zoomed in) needs to be kept in focus. Further close below this level, may see the pair trading even lower towards 103.76. However, the weekly supports underlined on the chart should be watched along the way.
On the other hand, any failure to close below the low end of current zone could push the price towards the high end of the zone. Nonetheless, the weekly resistance levels marked on the chart need to be considered. See the chart to know more about the higher trading zone with the significant weekly resistance levels in a further bullish scenario.
Written By: Mahmoud Alkudsi
Please feel free to contact me on Twitter: @Malkudsi


