


Bitcoin (BTC/USD), Litecoin (LTC/USD), Ripple (XRP/USD), Technical Analysis – Talking Points
- Mastercard said to begin opening network to certain cryptocurrencies
- BTC/USD, LTC/USD, XRP/USD struggled to capitalize on this news
- Signs of fading momentum are present, where are key support levels?

Cryptocurrencies have been on a tear lately, amplified by Tesla’s adoption of Bitcoin as a form of payment for its products in the future. On top of this, prospects of US fiscal stimulus may also be contributing to gains in BTC/USD, LTC/USD and XRP/USD. Now Mastercard Inc, an American multinational financial services corporation, announced that it will start allowing cardholders to transact in certain cryptocurrencies.
Despite this announcement, Bitcoin, Litecoin and Ripple struggled to capitalize. This is as signs of fading upside momentum appear across these cryptocurrencies. In the event of a turn lower, how far might BTC, LTC and XRP go given recent price action? These can be quite volatile, and investors ought to take this into account when considering downside potential.
Bitcoin Technical Outlook
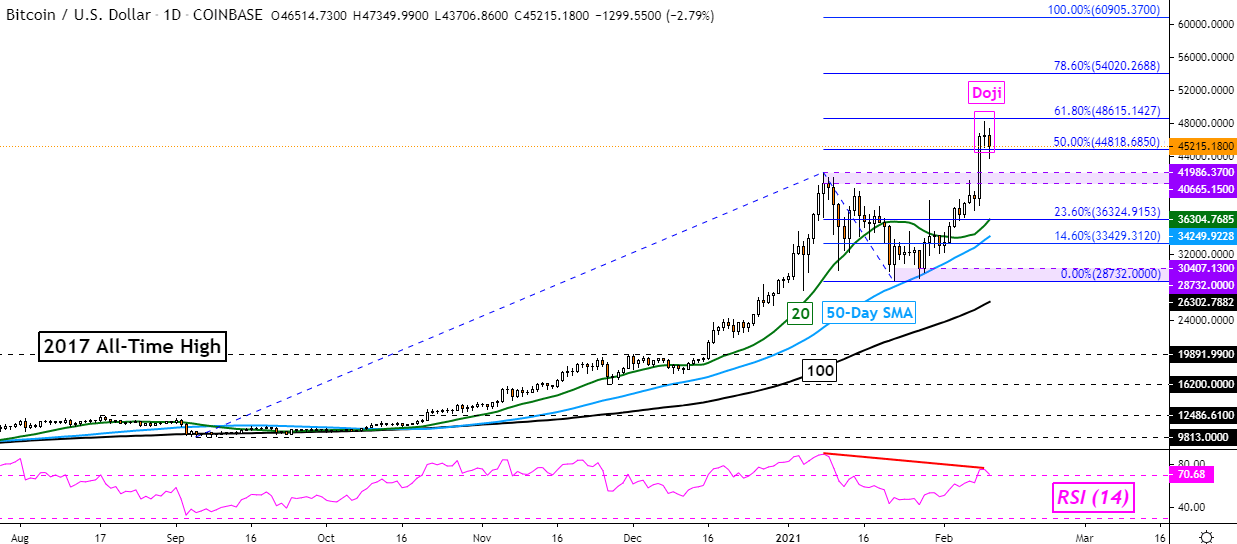
Bitcoin has left behind a neutral Doji candlestick pattern over the past 24 hours. This is typically a sign of indecision which can at times precede a reversal when it appears within an uptrend or downtrend. Furthermore, negative RSI divergence shows that upside momentum is fading. Should prices fall, keep a close eye on the 20-day, 50-day and 100-day Simple Moving Averages (SMAs) for potential support.
These could reinstate the focus to the upside. However, even getting to just the 20-day one entails a drop through January peaks (40665 – 41986) towards the 23.6% Fibonacci extension at 36324. Immediate support seems to be the midpoint of the extension at 44818. Clearing the latter may place the focus on peaks from earlier this year. Otherwise, uptrend resumption has the 61.8% level at 48615 eyed as key resistance.
BTC/USD - Daily Chart
Litecoin Technical Outlook
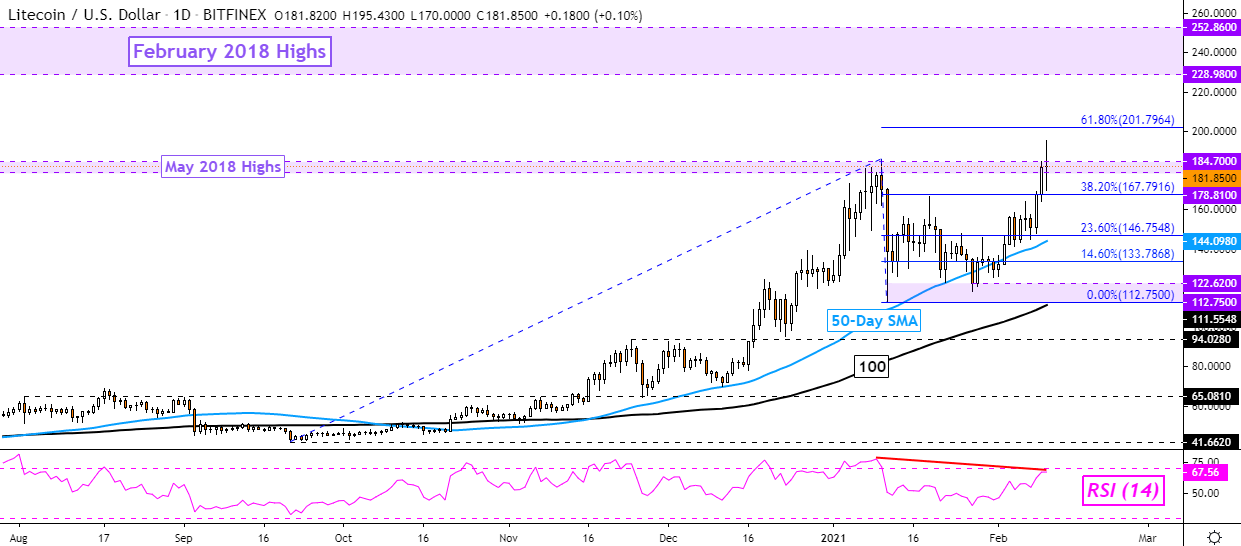
Litecoin is attempting to breach January highs which are also closely aligned with peaks witnessed in May 2018. This makes for a key range of resistance between 178.81 and 184.70. Here negative RSI divergence is also present, warning that upside momentum is fading. A turn lower from here places the focus on the 38.2% Fibonacci extension at 167.79. Below that sits the 50-day SMA around the 23.6% level at 146.75l. Otherwise, uptrend resumption as the 61.8% extension eyed at 201.79.

LTC/USD- Daily Chart
Ripple Technical Outlook
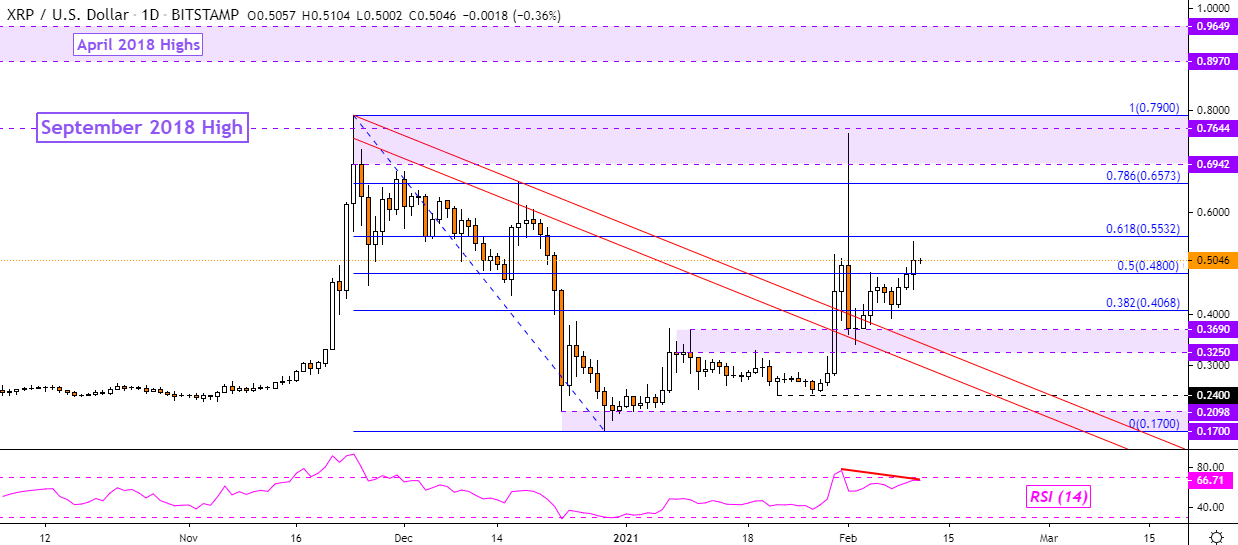
Ripple is aiming to confirm the breakout above peak closes seen in late January. That does not include the large wick on February 1st that briefly touched highs from November 2020 before reversing course and leaving behind an impressive trading range. Negative RSI divergence is accompanying the pair as prices aim for the 61.8% Fibonacci retracement at 0.5532. XRP/USD has largely been trading sideways since November, but the cryptocurrency did break above a falling range of resistance from then – see chart below. A turn lower may see prices make their way to the 0.3250 – 0.3690 inflection zone.
XRP/USD - Daily Chart
--- Written by Daniel Dubrovsky, Strategist for DailyFX.com
To contact Daniel, use the comments section below or @ddubrovskyFX on Twitter


