


EURO STOXX, GERMAN BUND, Technical Analysis – Talking Points:
- Euro Stoxx 50, German Bund have traced out risk-on moves since September
- Technical positioning hints three-month trends might be ready to be reversed
- Confirmation is still pending on a break of defining support, resistance levels
Where will markets end 2019? See our Q4 forecasts for currencies, commodities and stock indexes !
The Euro Stoxx 50 stock index – a catch-all benchmark for Eurozone equities – has been tracking higher alongside moderating 2020 Fed rate cut expectations since early September as risk appetite firmed across global financial markets. Bellwether German 10-year bunds prices have fallen in tandem, reflecting ebbing demand for the relative safety of government debt.
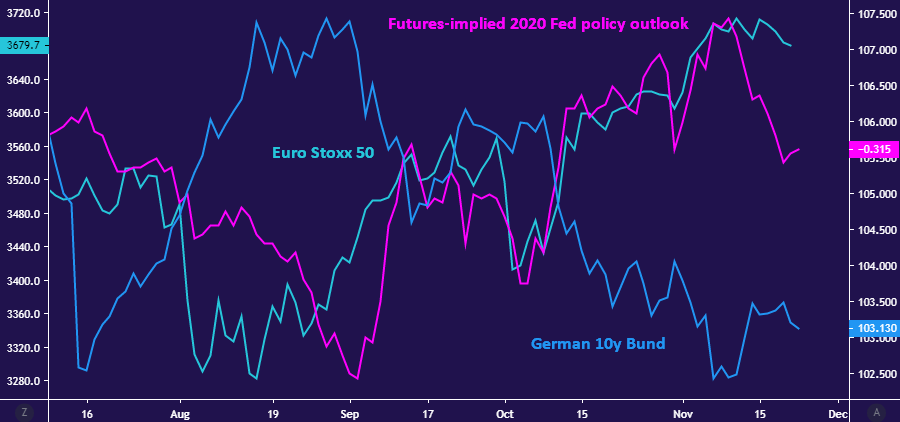
Chart created with TradingView
These moves appear to reflect ebbing worries about a “no-deal” Brexit as well as hopes for de-escalation in the US China trade war. Indeed, Fed Chair Jerome Powell and company directly asserted that risks on both fronts have diminished as it signaled that its rate cut cycle has been paused following last month’s gathering of the policy setting FOMC committee.
GERMAN BUND TECHNICAL ANALYSIS
Technical positioning now warns these moves may be running out of steam. For the Bund, the appearance of positive RSI divergence on a test of support at 102.17 – a sign of ebbing downside momentum – preceded a bounce to probe the bounds of the nearly three-month downtrend. If prices manage to close above that and the support-turned-resistance zone following immediately thereafter in the 104.19-47 area, the case for resumption of an uptrend established from October 2018 will seem compelling.
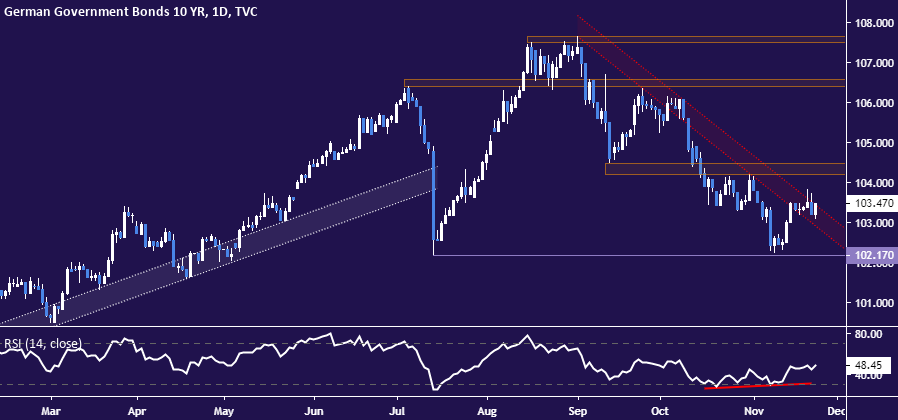
German Bund chart created with TradingView
EURO STOXX 50 TECHNICAL ANALYSIS
Meanwhile, the Euro Stoxx 50 chart shows prices struggling on a test of the October 2017 high at 3708.80, with negative RSI divergence suggesting a top might be in the works. Sellers face a thick layer of trend support runs down through 3573.60. If they can confirm its break on a daily closing basis, a three-month uptrend will appear to have been decisively overturned.
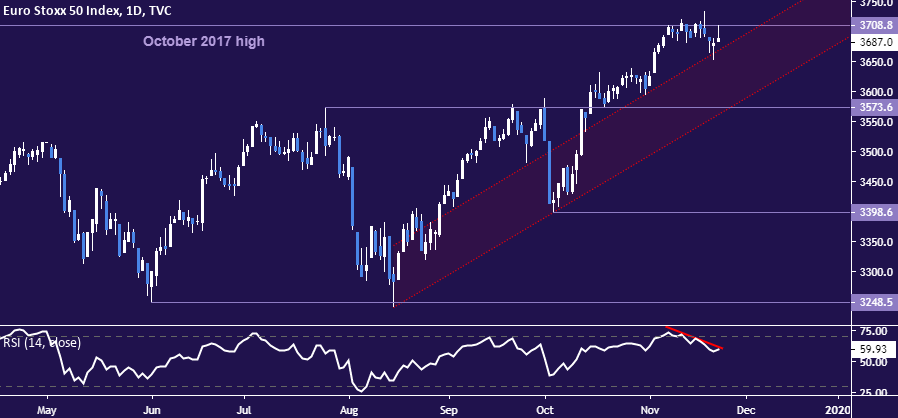
Euro Stoxx 50 chart created with TradingView
GERMAN BUND, EURO STOXX 50 TRADING RESOURCES
- Just getting started? See our beginners’ guide for FX traders
- Having trouble with your strategy? Here’s the #1 mistake that traders make
- Join a free webinar and have your questions answered
--- Written by Ilya Spivak, Currency Strategist for DailyFX.com
To contact Ilya, use the comments section below or @IlyaSpivak on Twitter


