


Brexit Latest Talking Points:
- A lack of new, negative developments around Brexit have given the GBP-crosses some room to rebound in the short-term.
- However, long-term fears of a no deal, “hard Brexit” are likely to linger as neither the UK nor the EU appears willing to abandon key positions once negotiations resume after summer holidays.
- Retail trader positioning suggests that the British Pound is likely to come under pressure again soon.
Looking for longer-term forecasts on the British Pound? Check out the DailyFX Trading Guides.
A lack of new, negative developments around Brexit have given the GBP-crosses some room to rebound in the short-term. However, long-term fears of a no deal, “hard Brexit” are likely to linger as neither the UK nor the EU appears willing to abandon key positions once negotiations resume after summer holidays.
And with the Federal Reserve’s Jackson Hole Economic Policy Symposium later this week, there are additional reasons for traders to take profits on recent trending positions – of which the British Pound qualifies – as volatility cools off. Short-term gains by GBP-crosses may simply be setting up better levels at which to enter the broader, longer-term downtrend.
GBPUSD TECHNICAL ANALYSIS: WEEKLY TIMEFRAME (JUNE 2016 TO AUGUST 2019) (CHART 1)
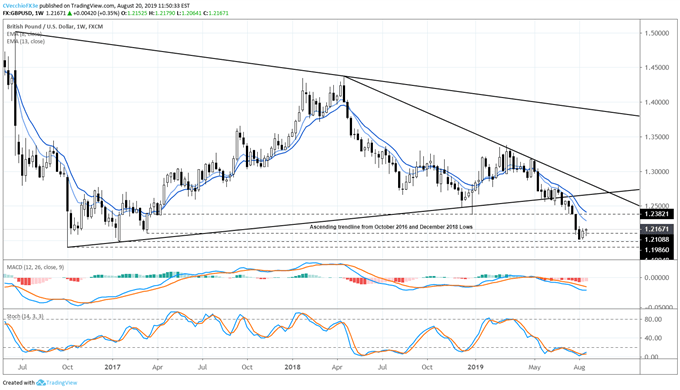
A look at the weekly timeframe highlights the destruction that Brexit has wrought upon the British Pound. An inside bar last week has reinforced the notion that a short-term rebound may be afoot. GBPUSD prices have remained below the weekly 8- and 13-EMAs since the first week of May. Overall, the January 2017 low is in focus at 1.1986, with the post-Brexit vote in October 2016 coming into focus shortly thereafter at 1.1905.
GBPUSD Technical Analysis: Daily Price Chart (August 2018 to August 2019) (Chart 2)

In our GBPUSD technical forecast last week, it was noted that “Only a close above the daily 8-EMA would throw into question the notion that the path of least resistance remains to the downside for GBPUSD.” That has indeed occurred, and now a bullish outside engulfing bar is forming on the daily timeframe.
A rebound by GBPUSD will gather pace if the daily 21-EMA is broken to the topside, of which GBPUSD prices have closed below every session since July 1. A close above the daily 21-EMA (1.2195) would increase the likelihood of a further rebound in GBPUSD prices back to the descending trendline from the May and June highs closer towards 1.2340 over the coming session.
IG Client Sentiment Index: GBPUSD Price Forecast (August 20, 2019) (Chart 3)

GBPUSD: Retail trader data shows 75.9% of traders are net-long with the ratio of traders long to short at 3.14 to 1. In fact, traders have remained net-long since May 6 when GBPUSD traded near 1.2986; price has moved 6.4% lower since then. The number of traders net-long is 0.6% lower than yesterday and 8.3% lower from last week, while the number of traders net-short is 13.2% lower than yesterday and 10.7% lower from last week.
We typically take a contrarian view to crowd sentiment, and the fact traders are net-long suggests GBPUSD prices may continue to fall. Traders are further net-long than yesterday and last week, and the combination of current sentiment and recent changes gives us a stronger GBPUSD-bearish contrarian trading bias.
GBPJPY Technical Analysis: Daily Price Chart (October 2016 to August 2019) (Chart 4)

GBPJPY prices have consolidated recent losses after falling through channel support on their way to fresh yearly lows. A return to the former channel support and daily 21-EMA can’t be ruled out in the near-term (129.90/130.32).
GBPJPY Technical Analysis: Daily Price Chart (August 2018 to August 2019) (Chart 5)
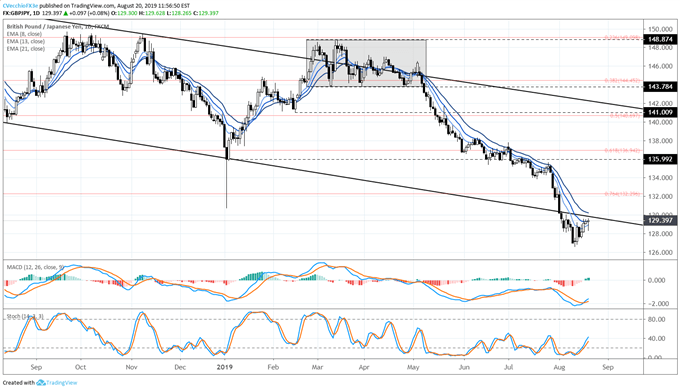
In our last update it was noted that “Traders may want to look at opportunities to sell rallies as a result rather than buying the low; a potential turn comes above the daily 21-EMA, which price has not closed above since May 6.” To this end, the daily 21-EMA has yet to be broken; while gains have been consistent in recent days, there is still not enough technical evidence to suggest that a bottom is in place. Selling rallies remains the preferred outcome for the time being.
IG Client Sentiment Index: GBPJPY Price Forecast (August 20, 2019) (Chart 6)
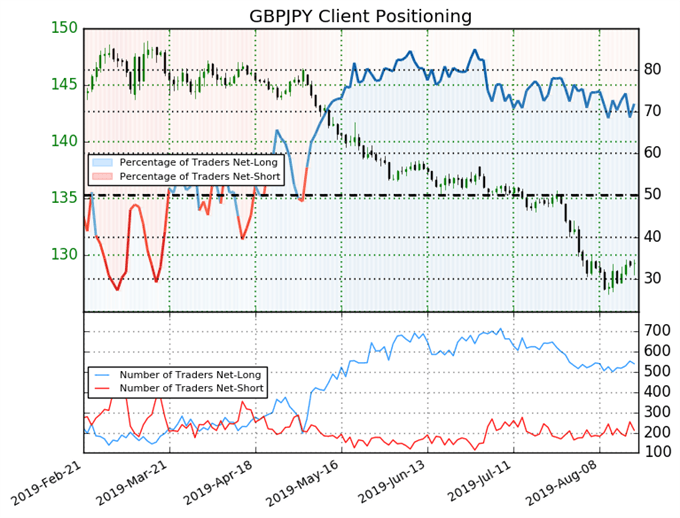
GBPJPY: Retail trader data shows 71.8% of traders are net-long with the ratio of traders long to short at 2.55 to 1. In fact, traders have remained net-long since May 6 when GBPJPY traded near 145.34; price has moved 11.1% lower since then. The number of traders net-long is 5.7% lower than yesterday and 5.1% lower from last week, while the number of traders net-short is 8.2% lower than yesterday and 21.5% lower from last week.
We typically take a contrarian view to crowd sentiment, and the fact traders are net-long suggests GBPJPY prices may continue to fall. Traders are further net-long than yesterday and last week, and the combination of current sentiment and recent changes gives us a stronger GBPJPY-bearish contrarian trading bias.
EURGBP Technical Analysis: Monthly Price Chart (1998 to 2019) (Chart 7)
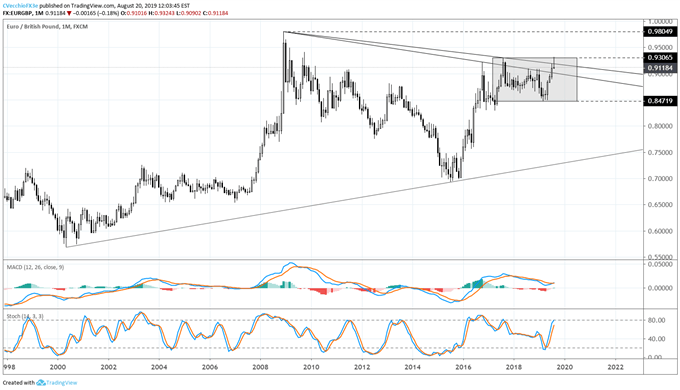
Prior to looking at the daily timeframe for EURGBP, it’s better to look at the monthly timeframe. Recent price action has challenged the August 2017 high, in turn attempting to breakout of a sideways channel going back to early-2017 between 0.8472 and 0.9307. But there may be a more significant break gathering steam: a bullish breakout from the symmetrical triangle that has defined nearly the entirety of EURGBP’s trading history, going back to the lows in 2000 and the highs in 2008.
EURGBP Technical Analysis: Daily Price Chart (August 2018 to August 2019) (Chart 8)
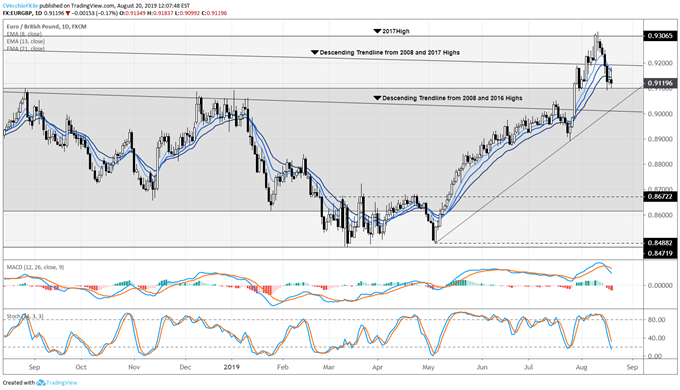
With the prospect of a major bullish breakout afoot, traders may want to pay more attention to EURGBP than the other GBP-crosses over the coming sessions. For the time being, EURGBP has been rejected by the August 2017 high as well as the descending trendline from the 2008 and 2017 highs.
Momentum has waned in recent days, with EURGBP prices now below the daily 8-, 13-, and 21-EMA envelope; daily MACD has turned lower, albeit in bullish territory; and Slow Stochastics has slumped into oversold territory. Remarkably, EURGBP has sustained elevated levels despite the bearish turn in momentum; the uptrend from the May and July 2019 lows has been sustained. Until this breaks, traders should be on alert for the longer-term upside breakout potential.
IG Client Sentiment Index: EURGBP Price Forecast (August 20, 2019) (Chart 9)
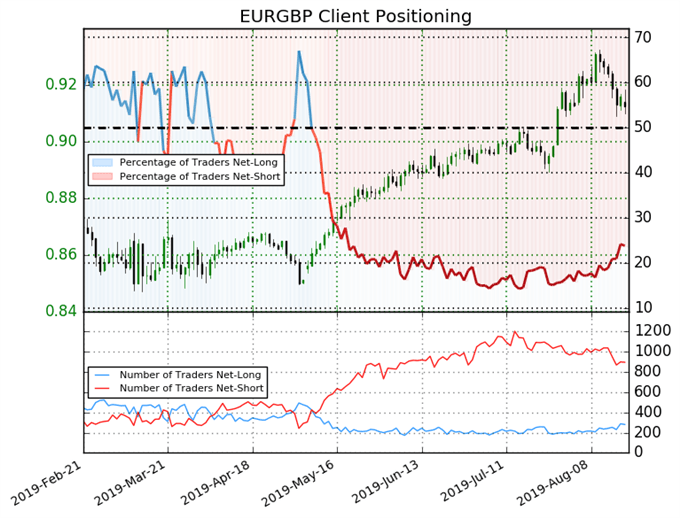
EURGBP: Retail trader data shows 23.9% of traders are net-long with the ratio of traders short to long at 3.19 to 1. In fact, traders have remained net-short since May 9 when EURGBP traded near 0.8674; price has moved 5.2% higher since then. The number of traders net-long is 6.0% lower than yesterday and 1.1% lower from last week, while the number of traders net-short is 0.1% higher than yesterday and 15.3% lower from last week.
We typically take a contrarian view to crowd sentiment, and the fact traders are net-short suggests EURGBP prices may continue to rise. Traders are further net-short than yesterday and last week, and the combination of current sentiment and recent changes gives us a stronger EURGBP-bullish contrarian trading bias.
What Happens to the British Pound: No Deal, Hard Brexit
Under a no-deal, hard Brexit outcome, traders should expect further losses by the British Pound, with EUR/GBP likely to trade closer to parity (1.0000), GBP/JPY could trade towards 120.00, while GBP/USD could fall towards 1.1000 during the first 12-months of a no-deal, hard Brexit (keeping in mind that the European Central Bank and Federal Reserve would likely cut interest rates to prevent Brexit shocks from impacting either the Eurozone or US economies too significantly, thereby capping potential gains by the Euro and the US Dollar versus the British Pound).
What Happens to the British Pound: No Deal, Hard Brexit + Scottish Exit
But this would not be the worst case scenario for the British Pound; in the event that Scotland holds a second independence referendum, it’s likely markets will be facing down the threat of disintegration of Great Britain as we know it. Under a no-deal, hard Brexit coupled with a Scottish vote to leave the UK, traders should expect EUR/GBP to climb towards 1.0500, GBP/JPY to fall towards 112.50, and GBP/USD to drop closer to 1.0500.
What Happens to the British Pound: Second Referendum
The only hope that the British Pound has for a significant recover is if Brexit is avoided altogether: after all, it will be impossible to replace the economic activity lost endured from leaving the EU, the world’s largest single market. In the event that the next UK prime minister has a change of heart and takes steps to avoid Brexit (e.g. a second referendum or withdrawing Article 50), EUR/GBP could fall back towards £0.8000, GBP/JPY could rally back towards 150.00, and GBP/USD could climb back towards $1.4000; a full-scale recovery back to pre-June 2016 Brexit vote levels is highly unlikely in the immediate aftermath of the cancellation of Brexit.
FX TRADING RESOURCES
Whether you are a new or experienced trader, DailyFX has multiple resources available to help you: an indicator for monitoring trader sentiment; quarterly trading forecasts; analytical and educational webinars held daily; trading guides to help you improve trading performance, and even one for those who are new to FX trading.
--- Written by Christopher Vecchio, CFA, Senior Currency Strategist
To contact Christopher Vecchio, e-mail at cvecchio@dailyfx.com
Follow him on Twitter at @CVecchioFX
View our long-term forecasts with the DailyFX Trading Guides


