


USD Technical Highlights:
- US Dollar Index (DXY) bouncing off support
- EURUSD tangled up in trend-lines
- GBPUSD bullish pattern still intact
- AUDUSD may soon be trading at fresh cycle lows
- USDJPY posting potentially bearish pattern
To see what fundamental drivers and technical signposts DailyFX analysts are watching, check out the Q2 forecasts for various markets on the DailyFX Trading Guides page.
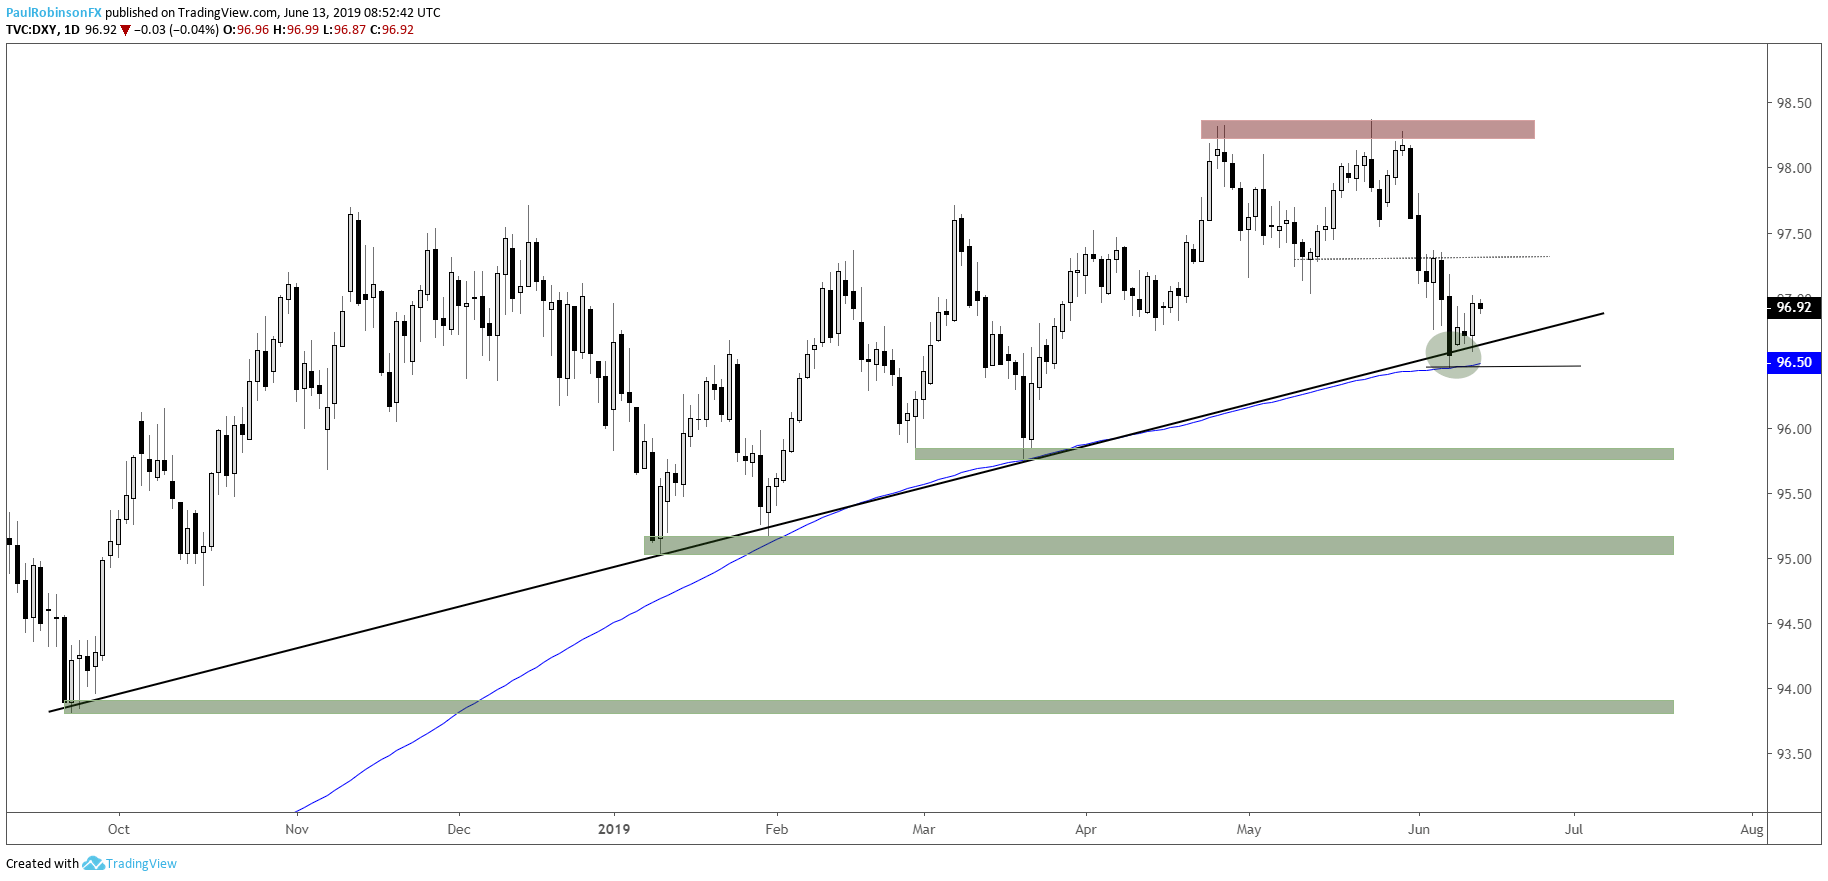
US Dollar Index (DXY) bouncing off support
The confluence of support by way of a trend-line (underside of broader wedge) and the 200-day is holding so far. The lift yesterday gets the DXY out of immediate danger, but will it last? Not sure, but as long as support doesn’t break then we must respect it.
Longs can use it as a line-in-the-sand, so can shorts. Stay above and the trading bias is neutral to bullish, drop below and that bias could aggressively turn in favor of sellers. A close below 96.46 should do the trick in flipping the script.
US Dollar Index (DXY) Daily Chart (support holding thus far)
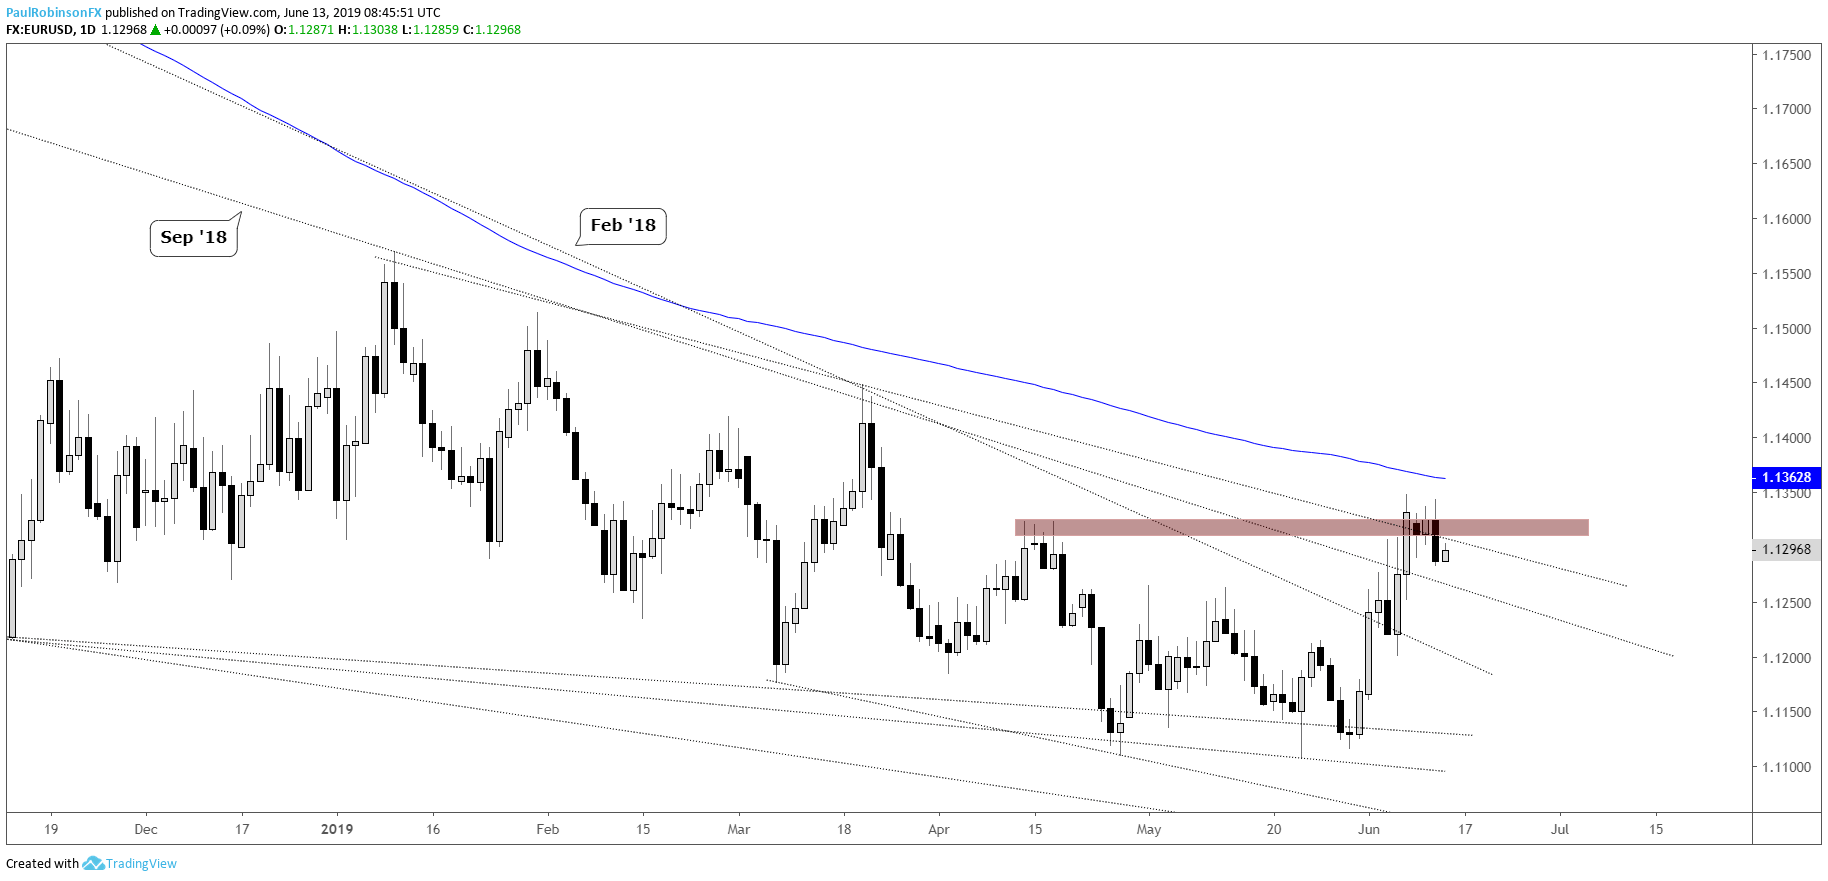
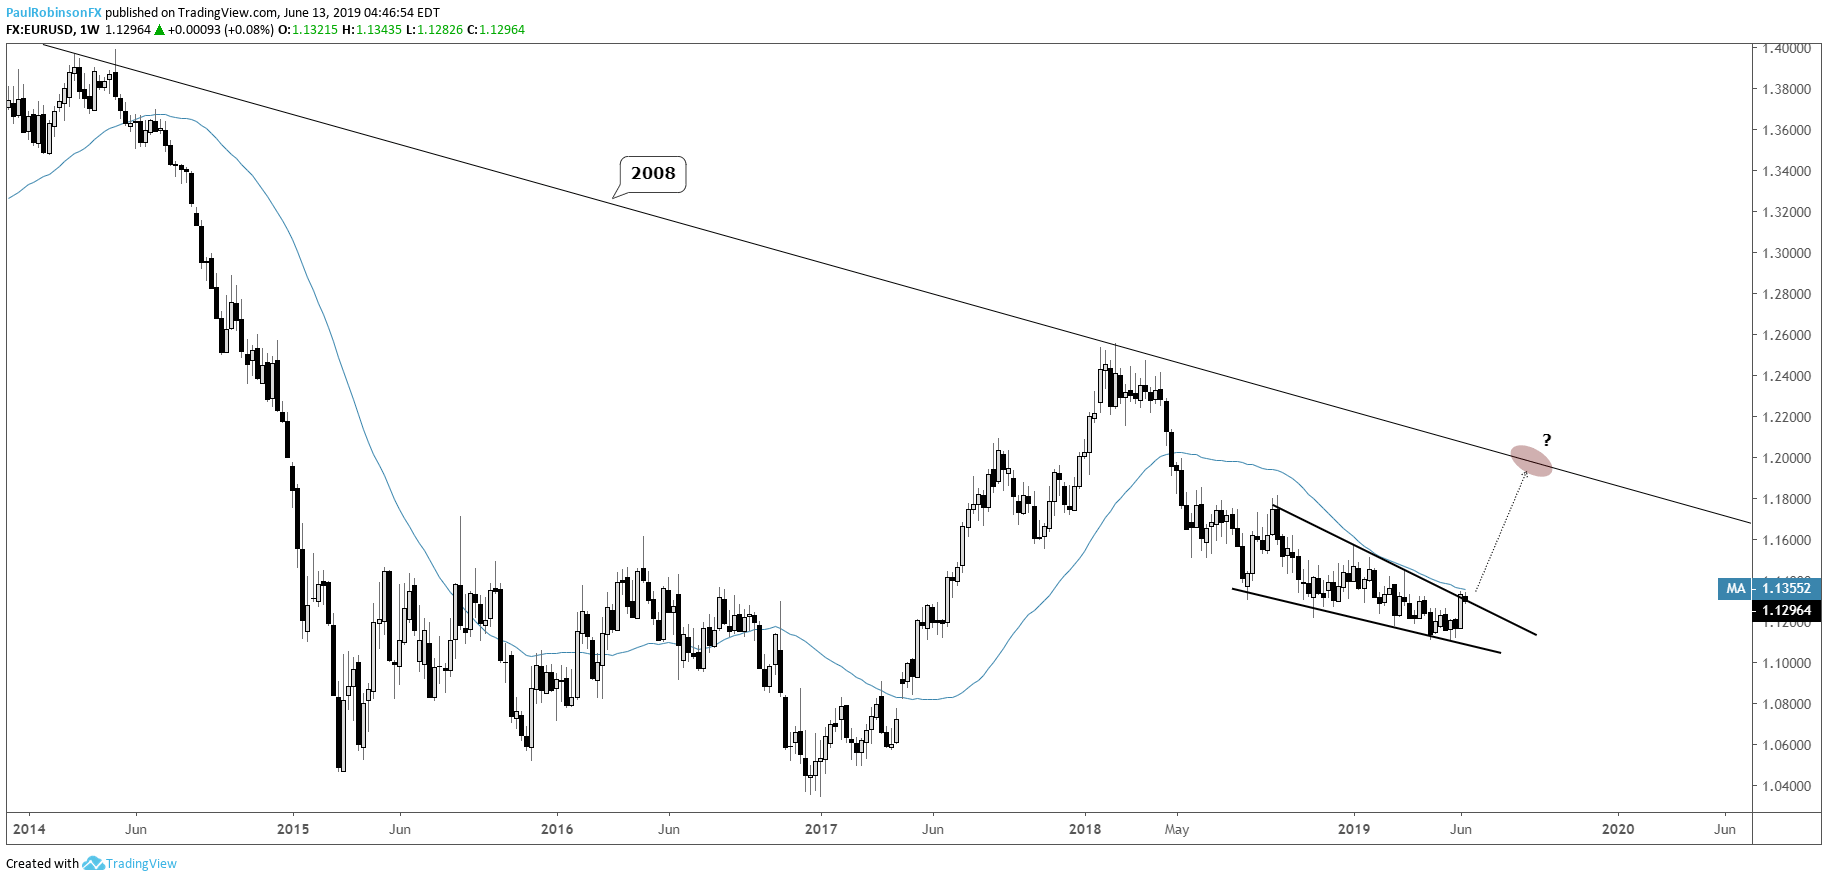
EURUSD tangled up in trend-lines
The Euro has been stuck amidst trend-lines coming down from several angles just as not long ago it had support lines running under it from several angles. This makes things a little messy, but the big threshold at the top of the falling weekly wedge has kept the advance recently form furthering itself (so far). Must respect resistance until broken, a break above 11348 and the 200-day just above there may have EURUSD accelerating higher. Stay below and the bias is neutral at best, to lower.
EURUSD Daily Chart (trend-line resistance)
EURUSD Weekly Chart (falling wedge)
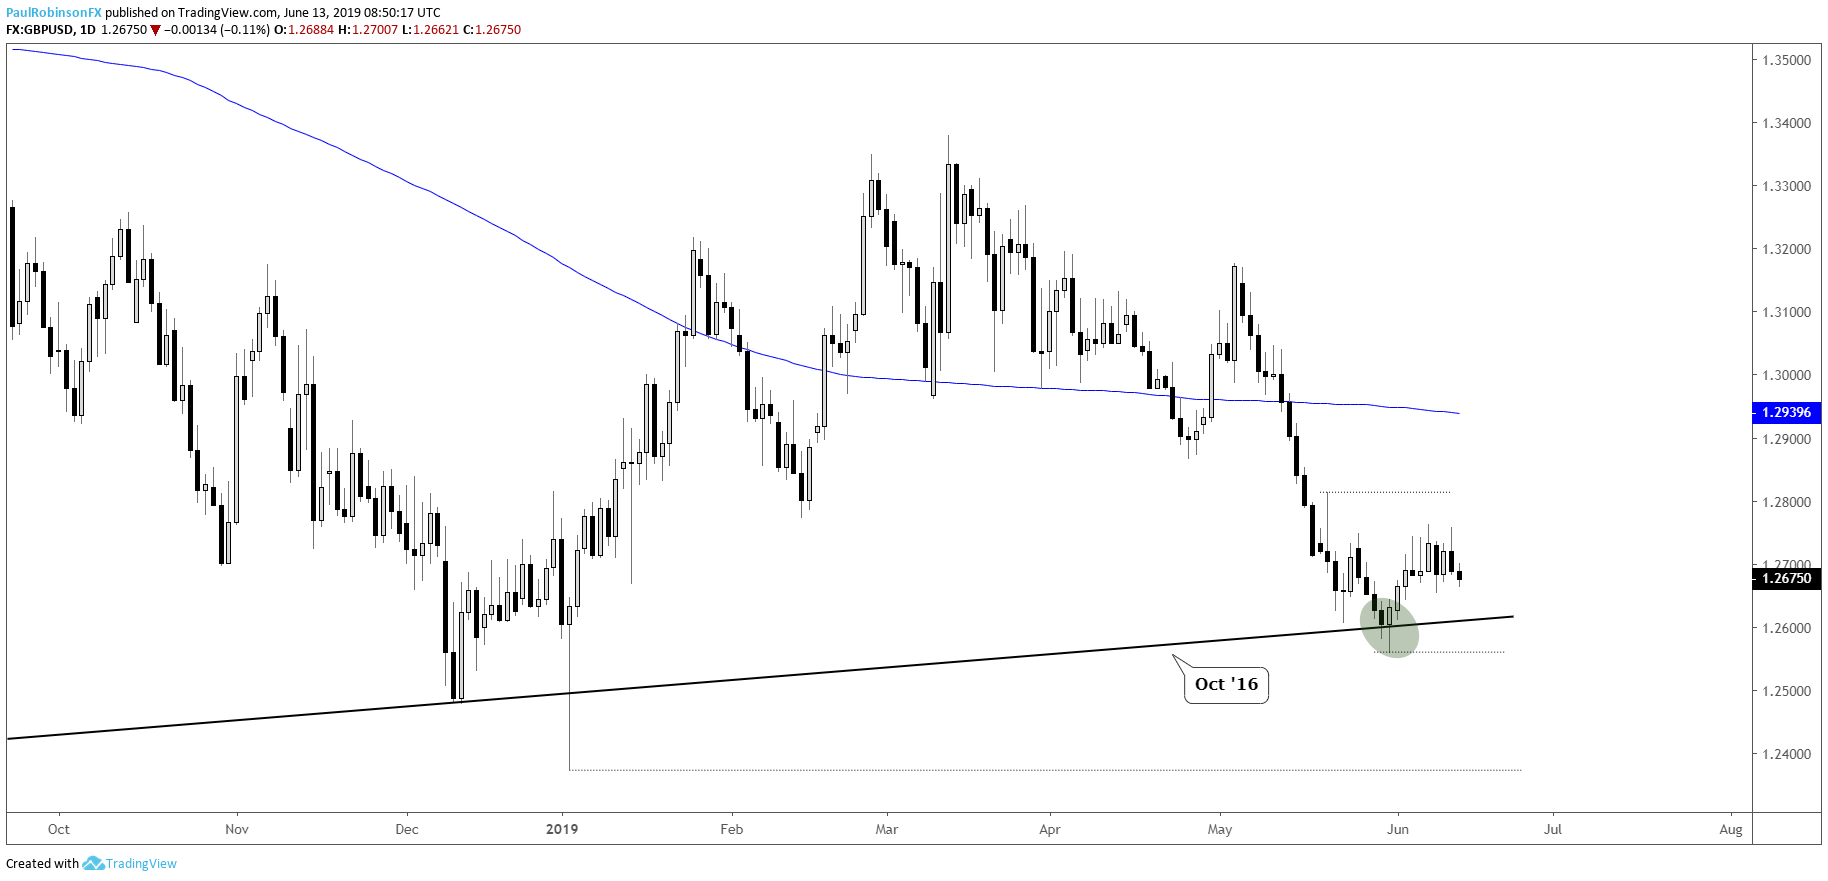
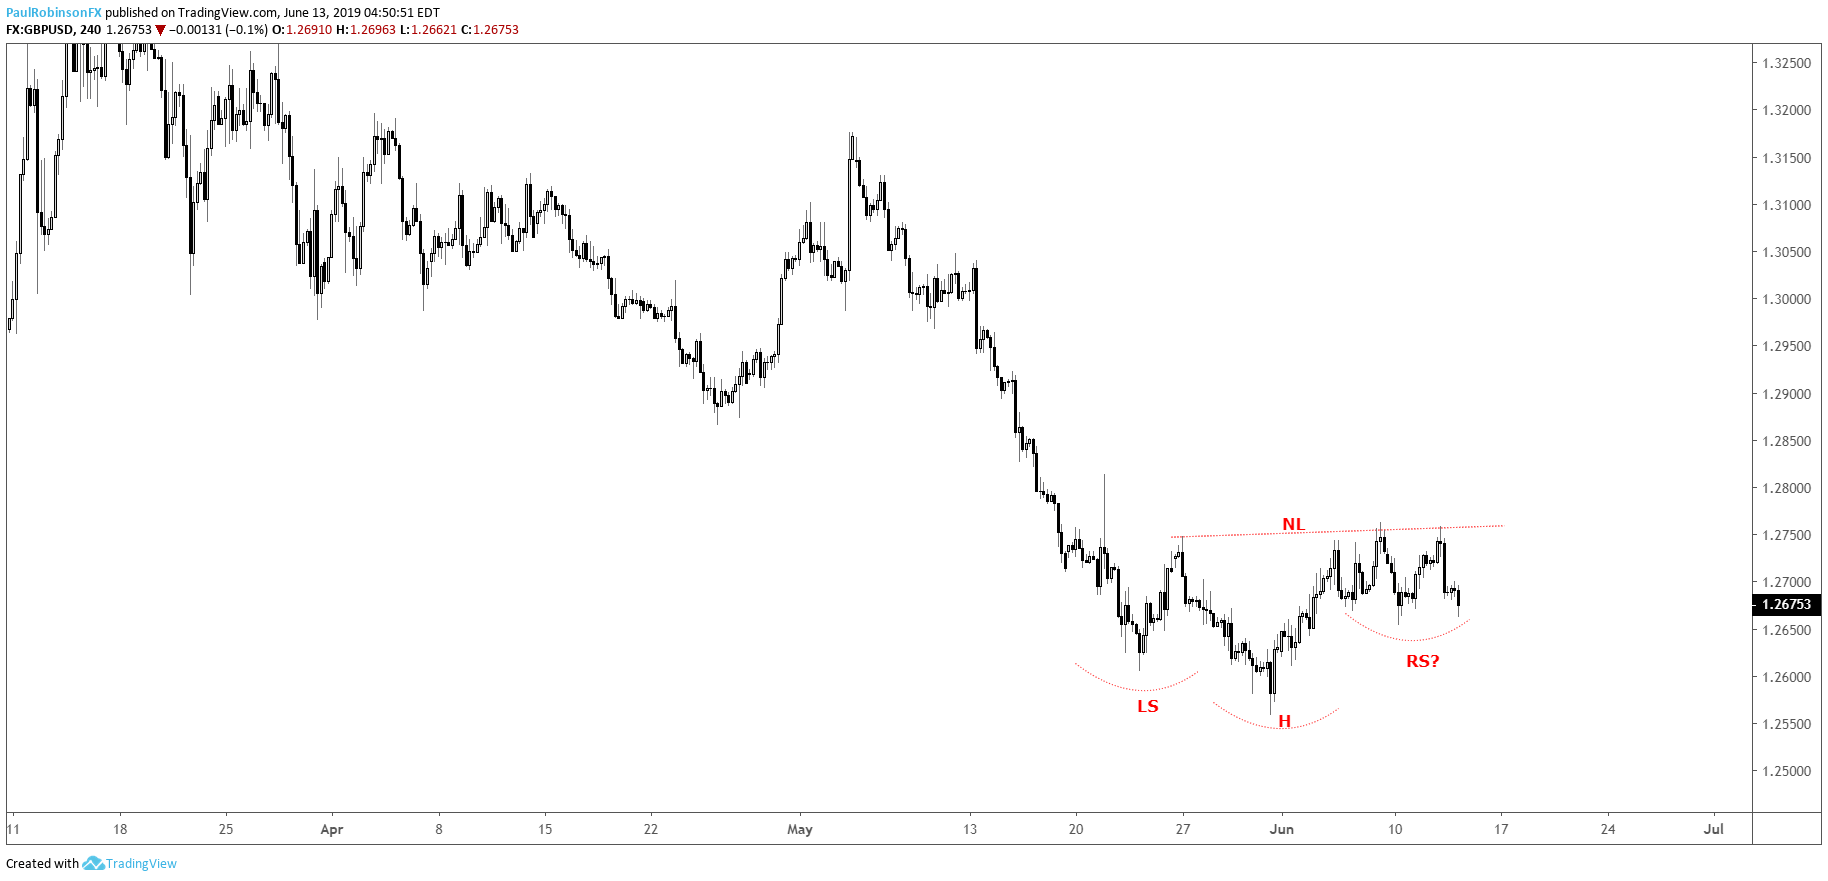
GBPUSD bullish pattern still intact
The inverse head-and-shoulders (H&S) pattern in Cable is still intact, but barely. It still needs to rally above the neckline to validate, it nearly did yesterday, but nearly isn’t good enough. A 4-hr closing candle above 12763 is needed to kick off a move higher. If it doesn’t soon get into gear, a retest of the October 2016 trend-line (or worse) may be in store.
GBPUSD Daily Chart (Oct ’16 t-line)
GBPUSD 4-hr Chart (inverse H&S pattern)
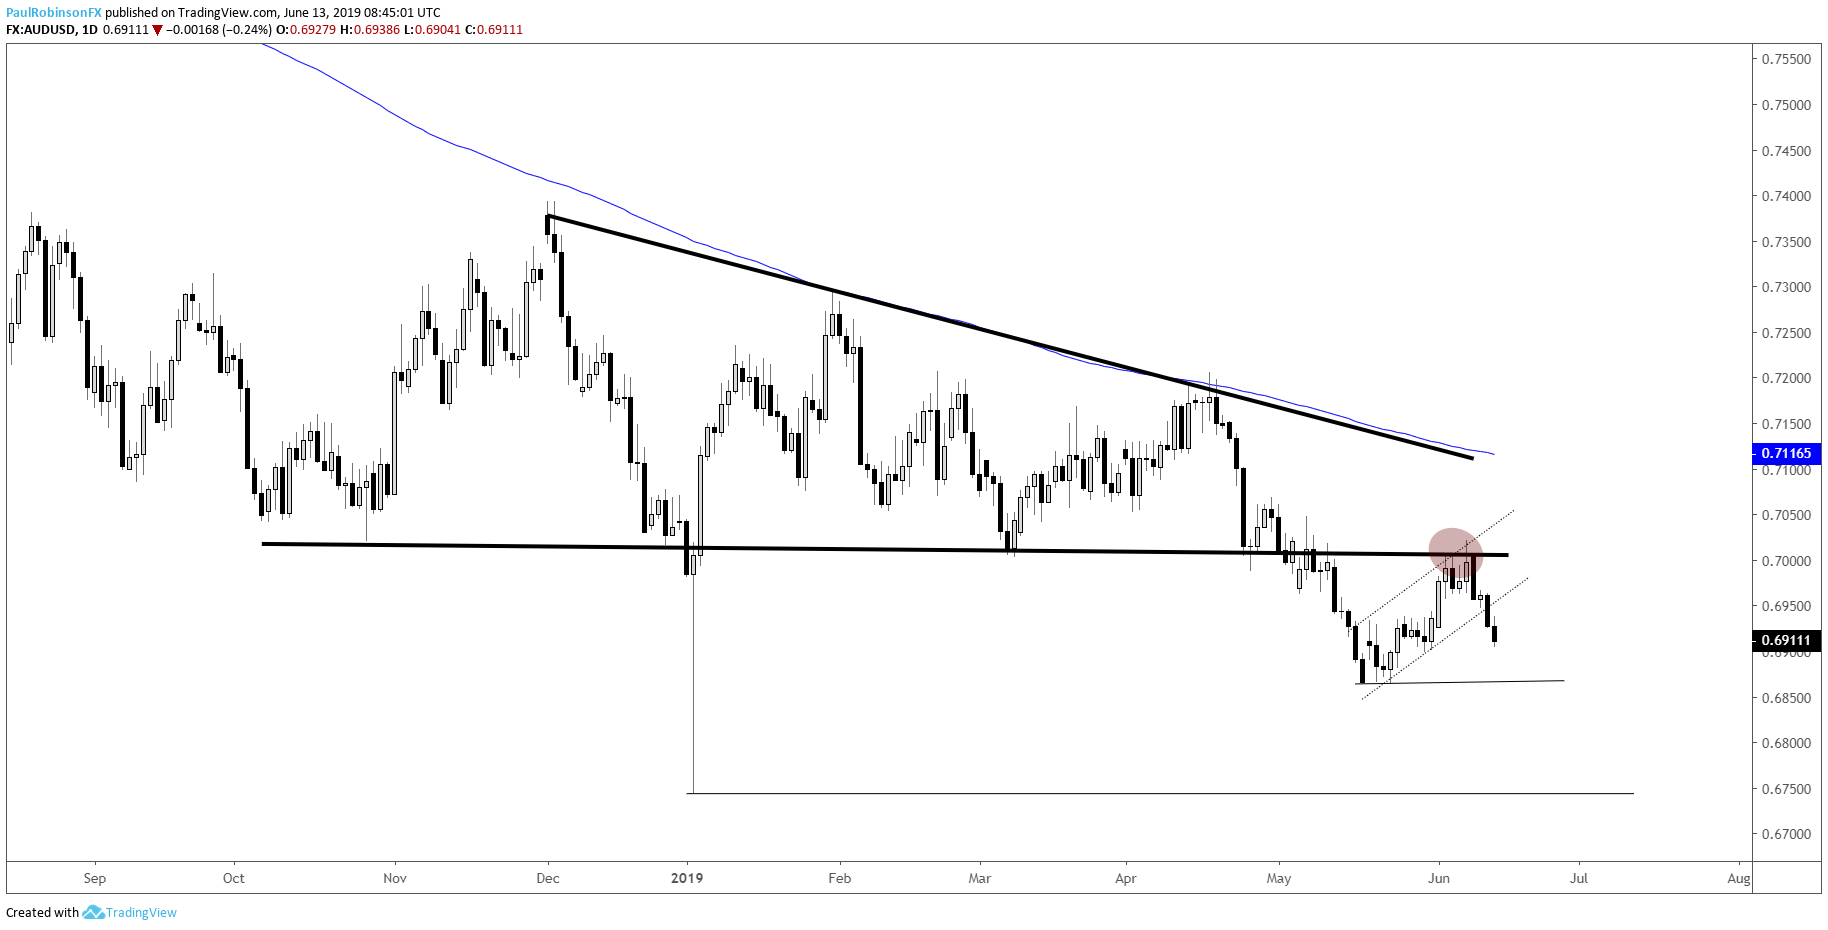
AUDUSD may soon be trading at fresh cycle lows
AUDUSD recently tested and validated the underside of the October-May descending wedge, which keeps the pressure on. Yesterday, a bear-flag/channel configuration was snapped, helping further along a down-move in the near-term. The recent low at 6847 down to the flash-crash low from Jan 3 at 6744 could soon come into play. To turn things neutral to higher a break back inside the wedge will be needed.
AUDUSD Daily Chart (looking towards recent low, flash-crash low)
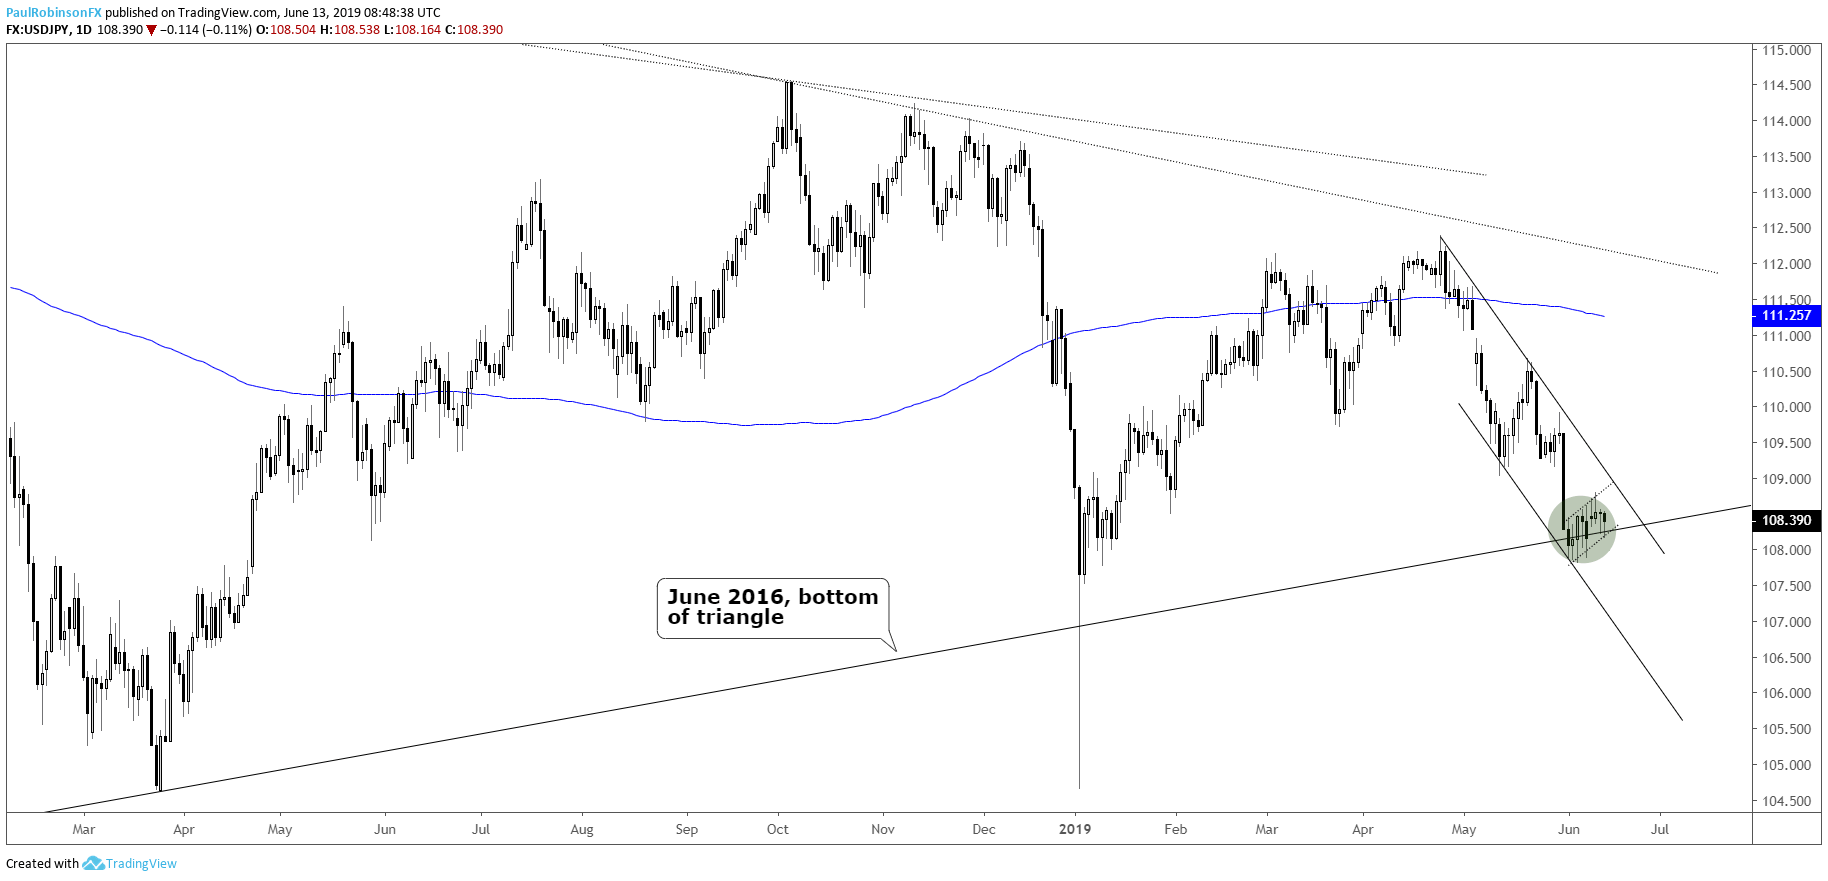
USDJPY posting potentially bearish pattern at big support
USDJPY isn’t particular inspired by the June 2016 trend-line so far, posting a potentially short-term bearish price sequence while sitting on it. The near-term price action is taking on the shape of a bear-flag within the confines of a set of downward sloping parallels. The battle of long-term trend support and short to intermediate-term bearish forces is making for an interesting dynamic.
A break of the bear-flag could set into motion a much larger break, but don’t be surprised if it turns out to be a fake-out given the long-term nature of support. Will run with a break, initially, but cautiously so. Trade higher above outside of the channel (from April high) and the outlook improves to the upside.
USDJPY Daily Chart (trading around trend-lines)
Forex & CFD Trader Resources
Whether you are a new or experienced trader, we have several resources available to help you; indicator for tracking trader sentiment, quarterly trading forecasts, analytical and educational webinars held daily, trading guides to help you improve trading performance, and one specifically for those who are new to forex.
---Written by Paul Robinson, Market Analyst
You can follow Paul on Twitter at @PaulRobinsonFX


