


ASEAN Technical Outlook – USD/PHP, USD/SGD, USD/MYR, USD/IDR
- USD/PHP climbs through near-term resistance as trend line supports climb
- Several reversal warning signs hint the Singapore Dollar could appreciate
- USD/MYR potentially faces the longest weekly rising streak in over 14 years
Read this week’s ASEAN fundamental outlook to see how forecasts compare with respective technical analysis!
USD/PHP Technical Analysis – Uptrend Resumes
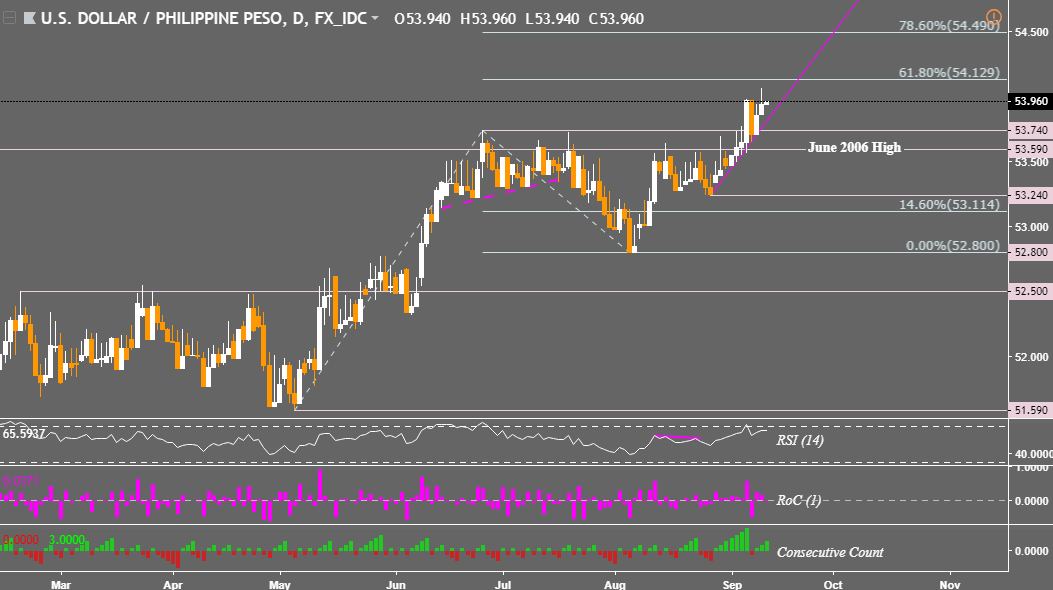
Philippine Peso prices broke above resistance at 53.74 (June, July, early September highs), signaling what could be resumption of the dominant near-term uptrend since early August. USD/PHP is also supported by a rising line from late August. The next target could be the 61.8% Fibonacci extension at 54.12, a push above that exposes the 78.6% level at 54.49. A descent through support could see the pair testing 53.24.
USD/PHP Daily Chart
USD/SGD Technical Analysis – June Trend Line Eyed?
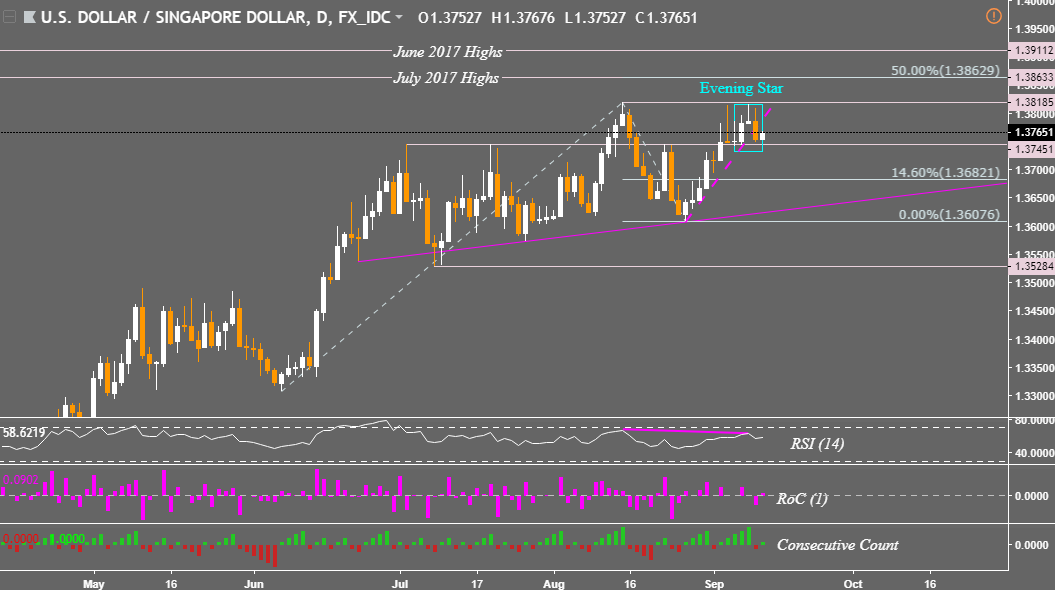
USD/SGD prices experienced a breakout as expected and it seems that the pair’s next leg could be lower. An Evening Star bearish reversal candlestick pattern emerged after a descent through the near-term rising trend line from late August. However, the pair remains upheld by horizontal resistance now support at 1.3745. The Singapore Dollar could eye the rising trend line from June should that area give way amidst negative RSI divergence as well. It warns that USD/SGD’s progress higher is running out of momentum.
USD/SGD Daily Chart
USD/MYR Technical Analysis – Potential Longest Weekly Rising Streak in 14 Years!
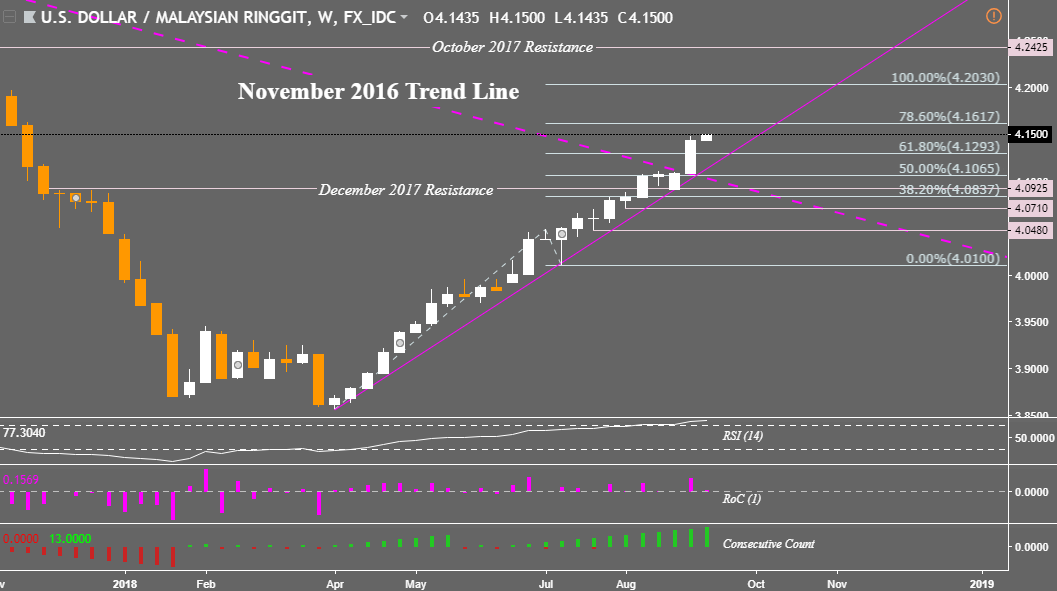
Malaysian Ringgit prices have clocked in a 12th week of consecutive losses against the US Dollar after the November 2016 resistance line was breached. Thus far, USD/MYR is on pace for a 13th week of upside progress. Completing this would mark its longest rising streak since August 2004, over 14 years ago. The pair’s uptrend could pause next on the 78.6% Fibonacci extension at 4.1617. Meanwhile support is at 4.1293.
USD/MYR Weekly Chart
USD/IDR Technical Analysis – Ascent Pauses
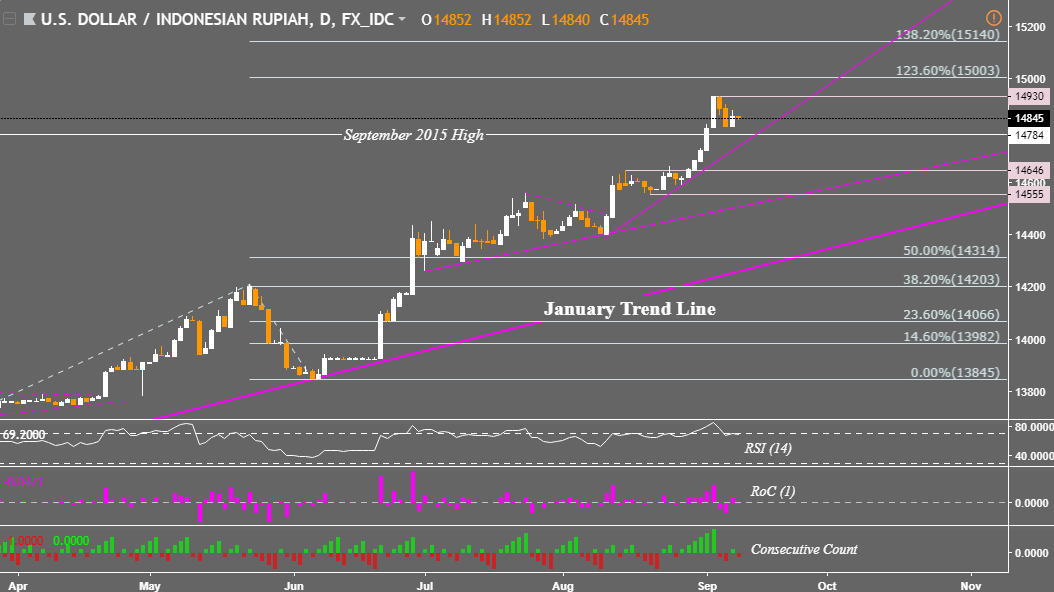
Since surpassing Asia Financial Crisis levels, the Indonesian Rupiah’s depreciation against the US Dollar has taken a break. Near-term resistance was formed around 14,930. With that, USD/IDR is now wedged in between that and the September 2015 high at 14,784. A climb above resistance exposes the 123.6% Fibonacci extension at 15,003. Meanwhile, a push under support exposes a near-term rising support line from August.
USD/IDR Daily Chart
Check out our 3Q forecasts for currencies like the US Dollar in the DailyFX Trading Guides page
**All Charts Created in TradingView
FX Trading Resources
- Join a free Q&A webinar and have your trading questions answered
- Just getting started? See our beginners’ guide for FX traders
- Having trouble with your strategy? Here’s the #1 mistake that traders make
- See how the US Dollar is viewed by the trading community at the DailyFX Sentiment Page
--- Written by Daniel Dubrovsky, Junior Currency Analyst for DailyFX.com
To contact Daniel, use the comments section below or @ddubrovskyFX on Twitter


