


We may soon see the cryptocurrency space once again struggle as big cross-roads come into view. Ethereum is heading towards a trend-line off last month’s high, which may mark an important second lower-high. Bitcoin is also rallying into a noteworthy zone of resistance. Litecoin crossed one threshold, with attention now turned towards another important one.
See how traders are positioned in Cryptocurrencies and what it might mean on the IG Client Sentiment page.
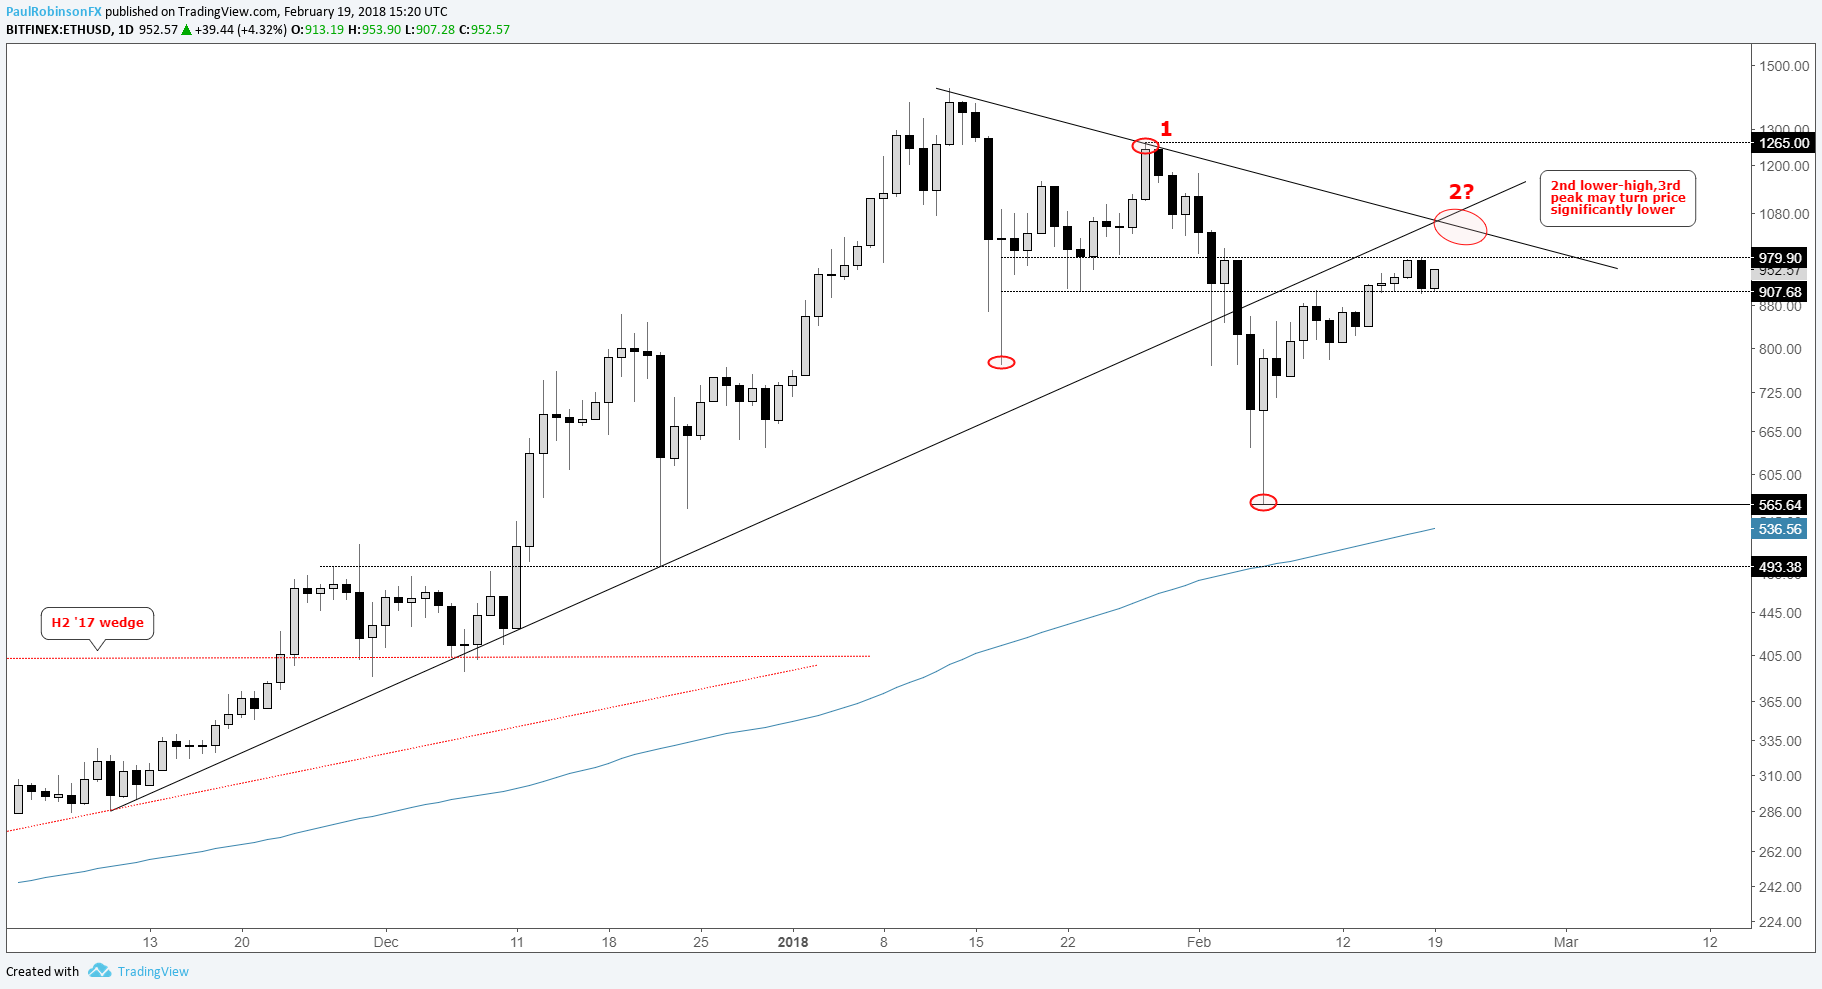
Ethereum headed towards trend-line, may mark important 2nd lower-high
In the short-term, there is support right around 900; it has held on several occasions in recent days. Looking higher, not far ahead is the trend-line running down off the high from last month. Depending on the timing it could be in confluence with a retest of the underside of the trend-line extending higher since November.
The overall price pattern could be decidely bearish if we see a strong turn down soon, whether from current levels or the aforementioned resistance. A topping sequence marked by a 2nd lower high (3rd peak) with an already existing lower-low earlier this month may lead to a strong reversal of fortune.
The broader stance remains that the best days are behind the cryptocurrency space, and with that, even though we have already seen major price declines there could be more pain to come. The big-picture targeted objective for ETH/USD is the apex of the ascending wedge which formed during the second half of 2017; ~400.
ETH/USD Daily Chart
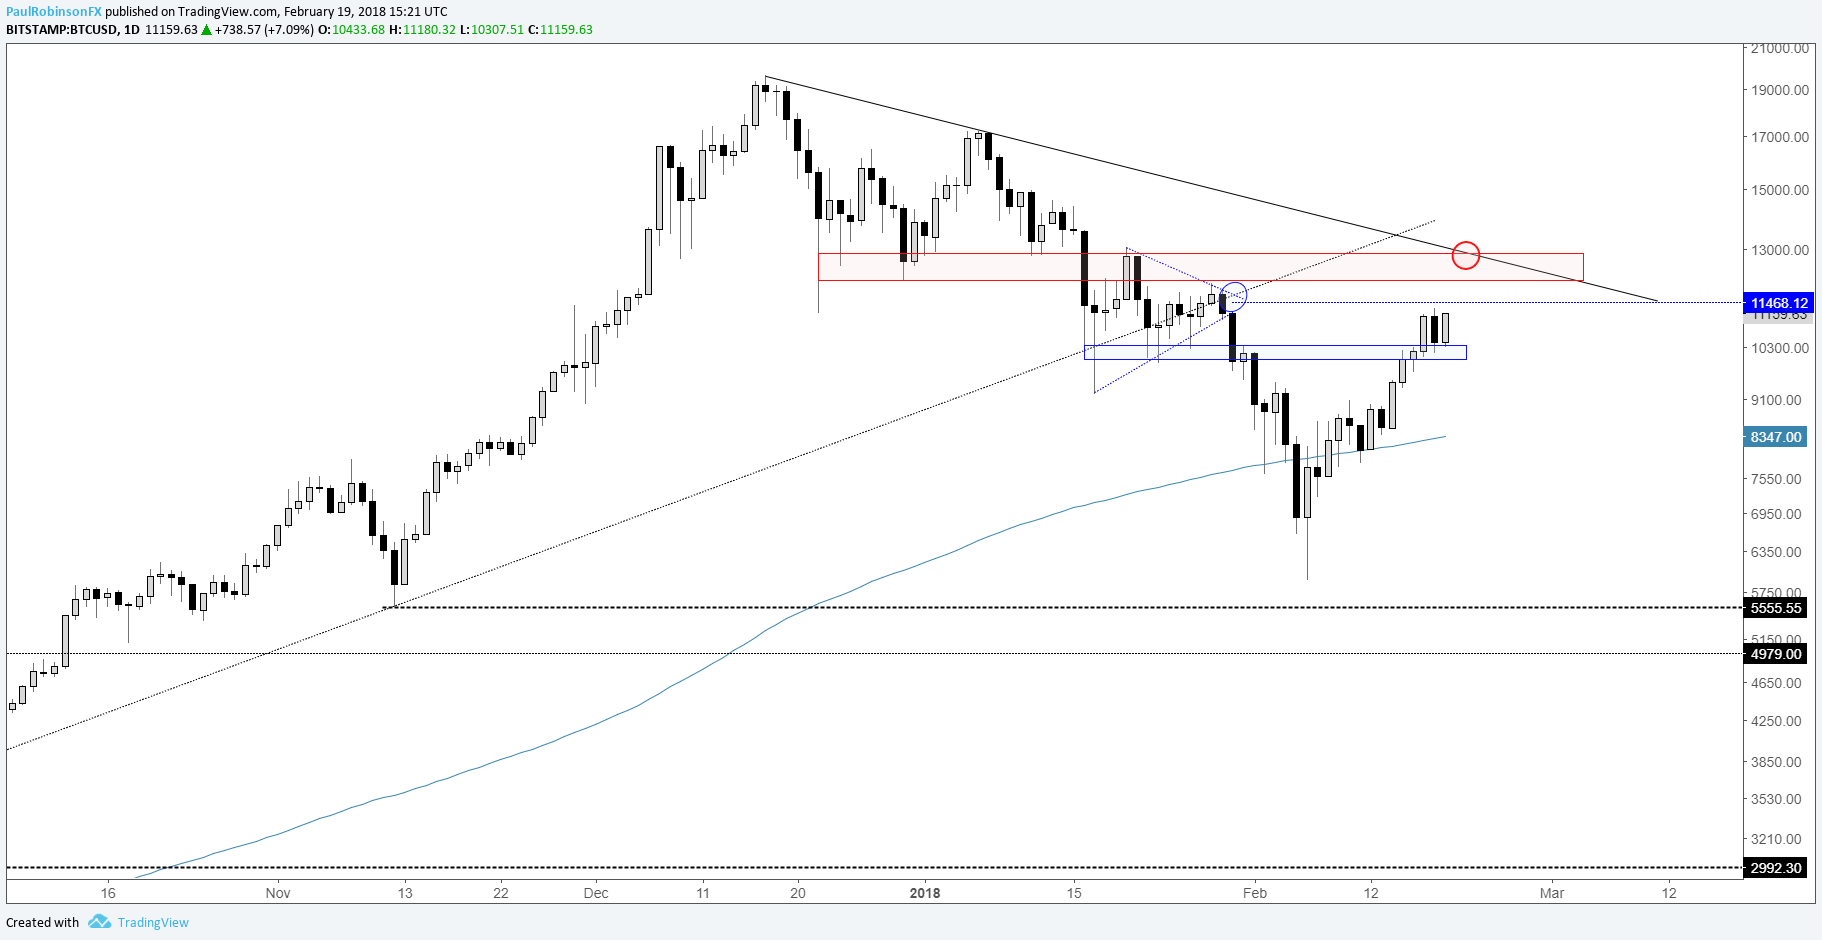
Bitcoin could soon find trouble in the vicinity of 12050/700
As we discussed in last week’s update, Bitcoin looked headed towards a full reversal of the sell-off from the triangle created in January. That has nearly been accomplished and has an even bigger area of resistance in sight.
There is horizontal resistance from just over 12k up to around 12700. Also running down through this area is the trend-line from the December high. The confluence of the two may prove to be difficult for Bitcoin to overcome and could put in another significant lower-high.
Want to learn more about cryptocurrencies? Check out this guide, Introduction to Bitcoin Trading
BTC/USD Daily Chart
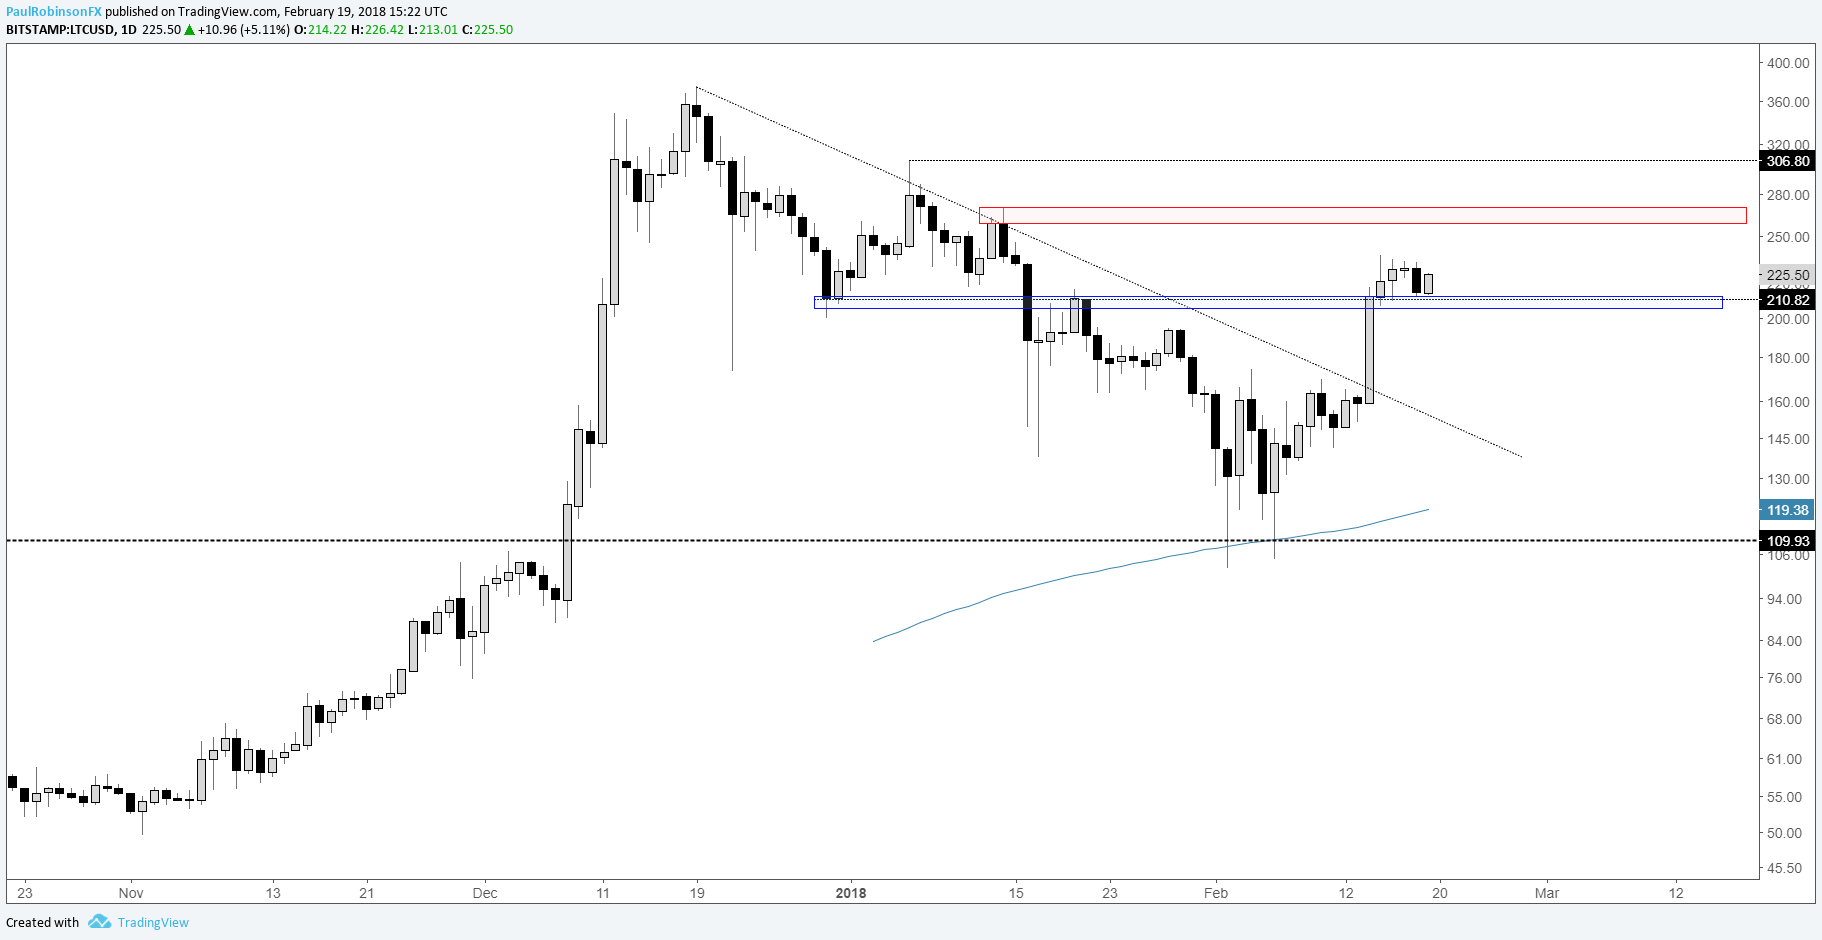
Litecoin has support close by, 260/70 next up as resistance
Last week, Litecoin broke through the 210-area of resistance we had penciled in (now making it a source of support). The next objective clocks in around a swing-high from last month in the vicinity of 260/70. Upon any failure to trade higher, a clear break back below 200 is seen as likely to spur sellers into action.
LTC/USD Daily Chart
Trader Resources
Whether you’re a new or experienced cryptocurrency trader, we have several resources to help you;Introduction to bitcoin trading guide, indicator for tracking trader sentiment, and a weekly webinar discussing the latest developments.
---Written by Paul Robinson, Market Analyst
To receive Paul’s analysis directly via email, please SIGN UP HERE
You can follow Paul on Twitter at @PaulRobinsonFX


