


Australian Dollar, AUD/USD, AUD/JPY, AUD/NZD, AUD/CAD – Weekly Technical Outlook
- Australian Dollar extended losses against major peers last week
- AUD/USD and AUD/JPY outlook remains tilted to the downside
- AUD/NZD showing signs of bottoming, AUD/CAD consolidates

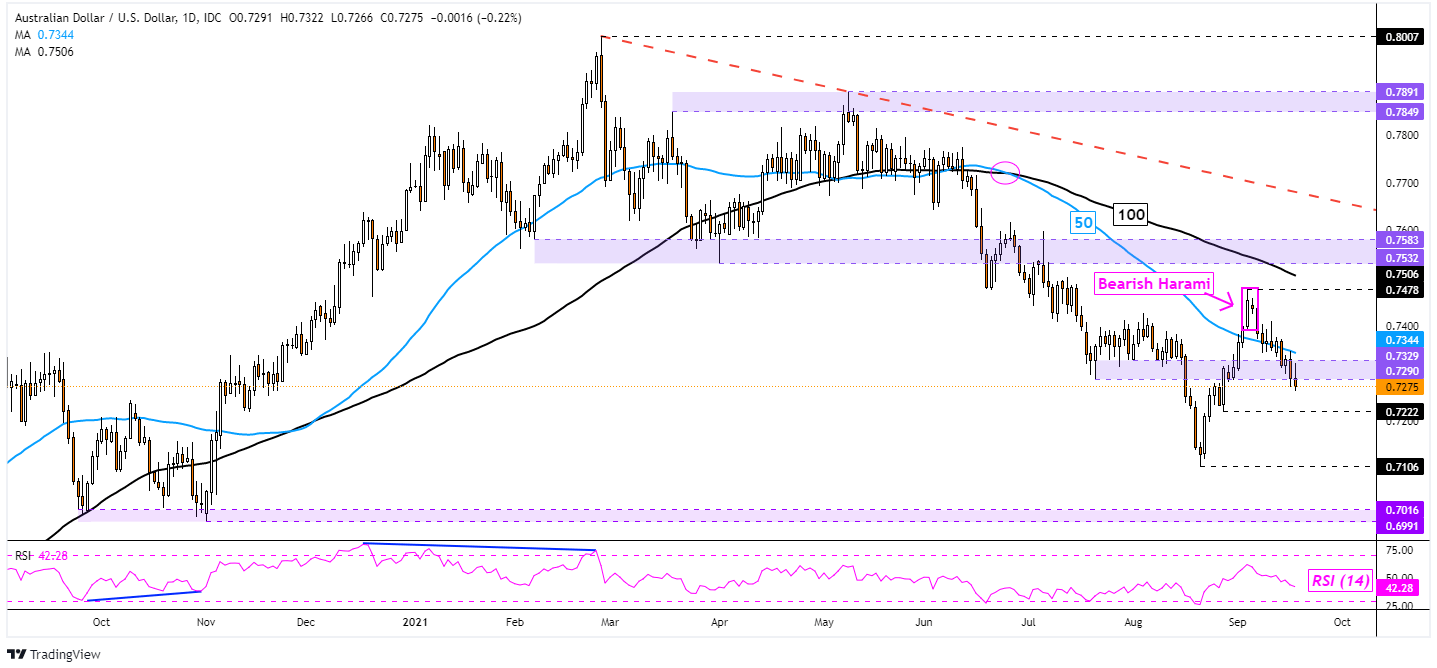
AUD/USD – Bearish
The US Dollar extended its gain against the Australian Dollar last week in the aftermath of a Bearish Harami candlestick pattern. AUD/USD found itself closing under the familiar 0.7329 – 0.7290 inflection zone, exposing the August 27th low at 0.7222. This is as a bearish Death Cross between the 50- and 100-day Simple Moving Averages (SMAs) underscores a downward technical bias.
Taking out the August 27th low may then open the door to revisiting the August trough at 0.7106 on the way towards the 0.7016 – 0.6991 support zone from the end of last year. Otherwise, a bounce back above the inflection zone could bring the early September high at 0.7478 into focus as key resistance. Getting there would entail taking out the 50-day SMA, which may act as resistance and pivot prices lower.
| Change in | Longs | Shorts | OI |
| Daily | -18% | 6% | -7% |
| Weekly | -21% | 26% | -3% |
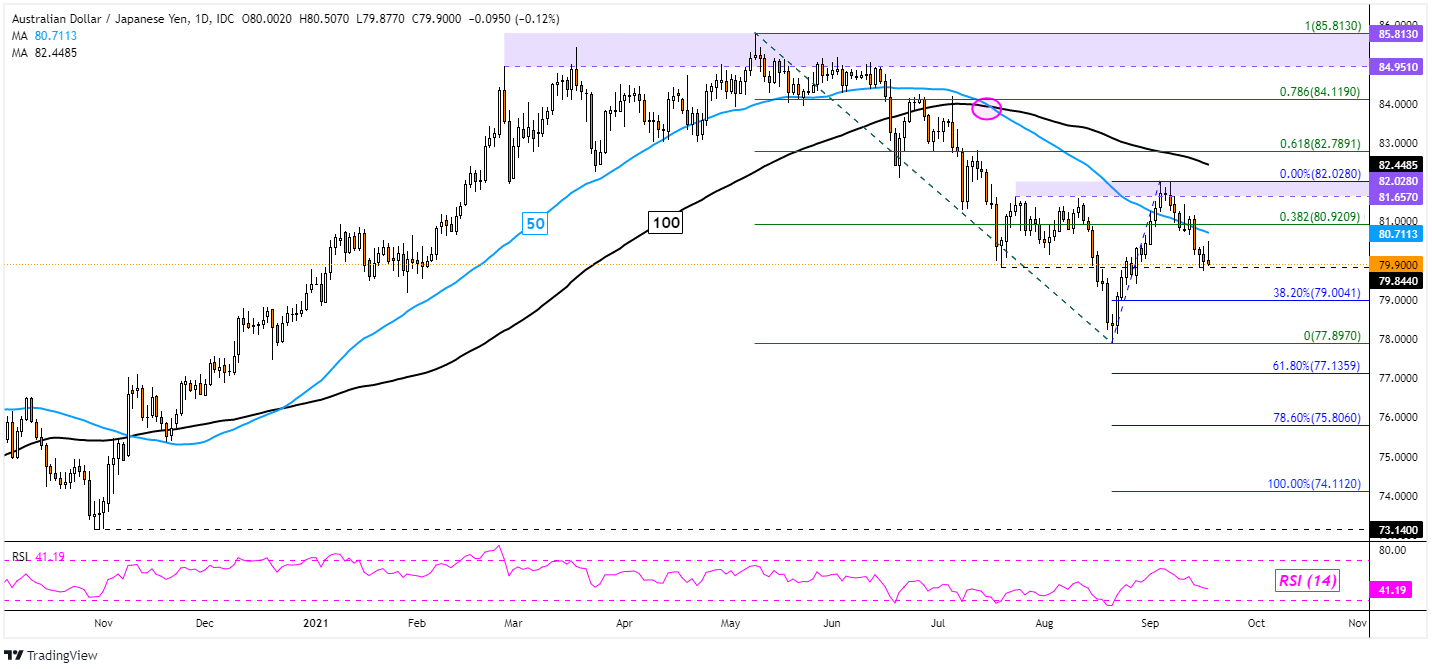
AUD/JPY – Bearish
The Australian Dollar also came under pressure against the Japanese Yen this past week. This followed AUD/JPY rejecting the key 81.657 – 82.028 resistance zone. Prices finished their descent on the 79.8440 inflection point. From here, a bounce back towards resistance could open the door to a bullish Inverse Head and Shoulders chart pattern.
Still, a bearish Death Cross between the 50- and 100-day SMAs continues to underscore a downward technical bias. Further losses from here exposes the 38.2% Fibonacci extension at 79.004 towards the August low at 77.897. Resuming the downtrend since May entails clearing the latter. Otherwise, a bounce higher would likely place the focus on the 50-day SMA.
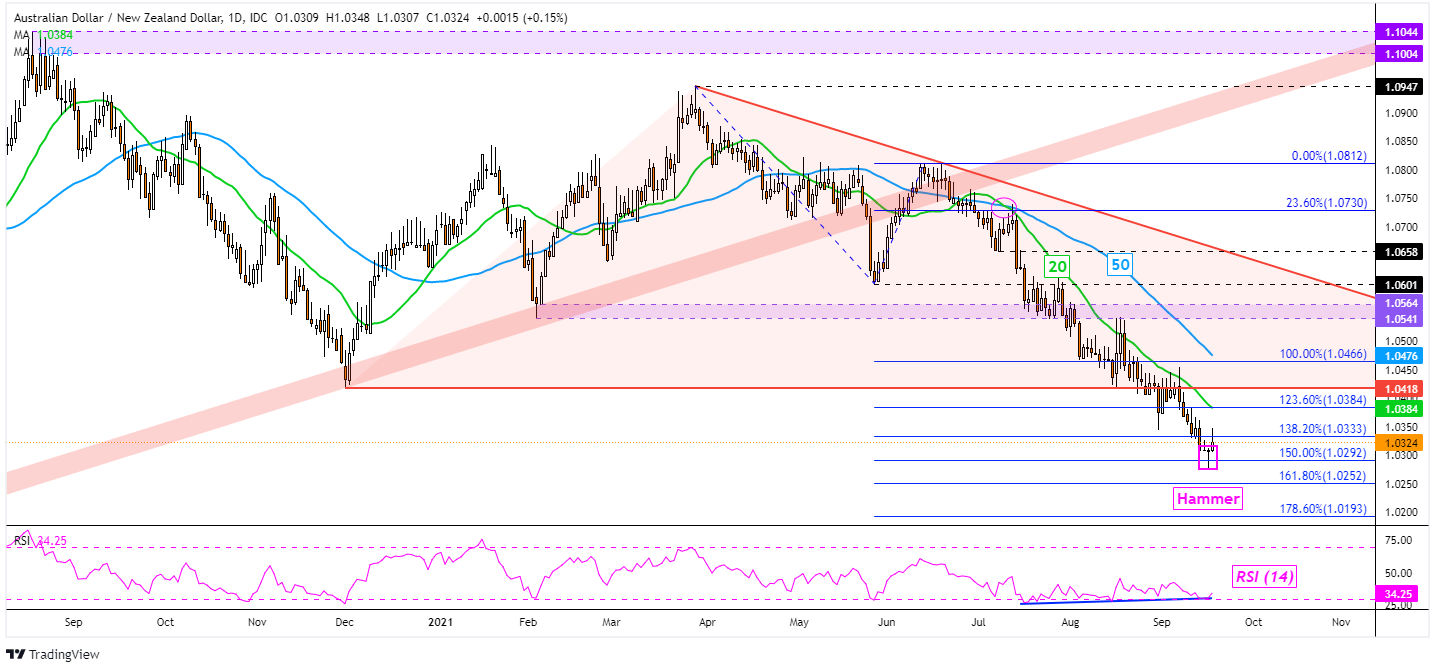
AUD/NZD – Slightly Bearish
While the Australian Dollar also lost ground to the New Zealand Dollar this past week, there are increasing signs that AUD/NZD could be readying to stage a reversal. Though confirmation is still lacking at this point. The pair left behind a bullish Hammer candlestick pattern, subsequently obtaining an upside close on Friday. This is as positive RSI divergence showed that downside momentum was fading.
Still, the pair was unable to hold a close above the 138.2% Fibonacci extension at 1.0333. Should that occur this week, it may increasingly open the door to a reversal of the dominant downtrend since March. That would likely place the focus on the 123.6% extension at 1.0384 towards the 1.0418 inflection point. Otherwise, downtrend resumption has the 161.8% level eyed at 1.0252.
Trade Smarter - Sign up for the DailyFX Newsletter
Receive timely and compelling market commentary from the DailyFX team
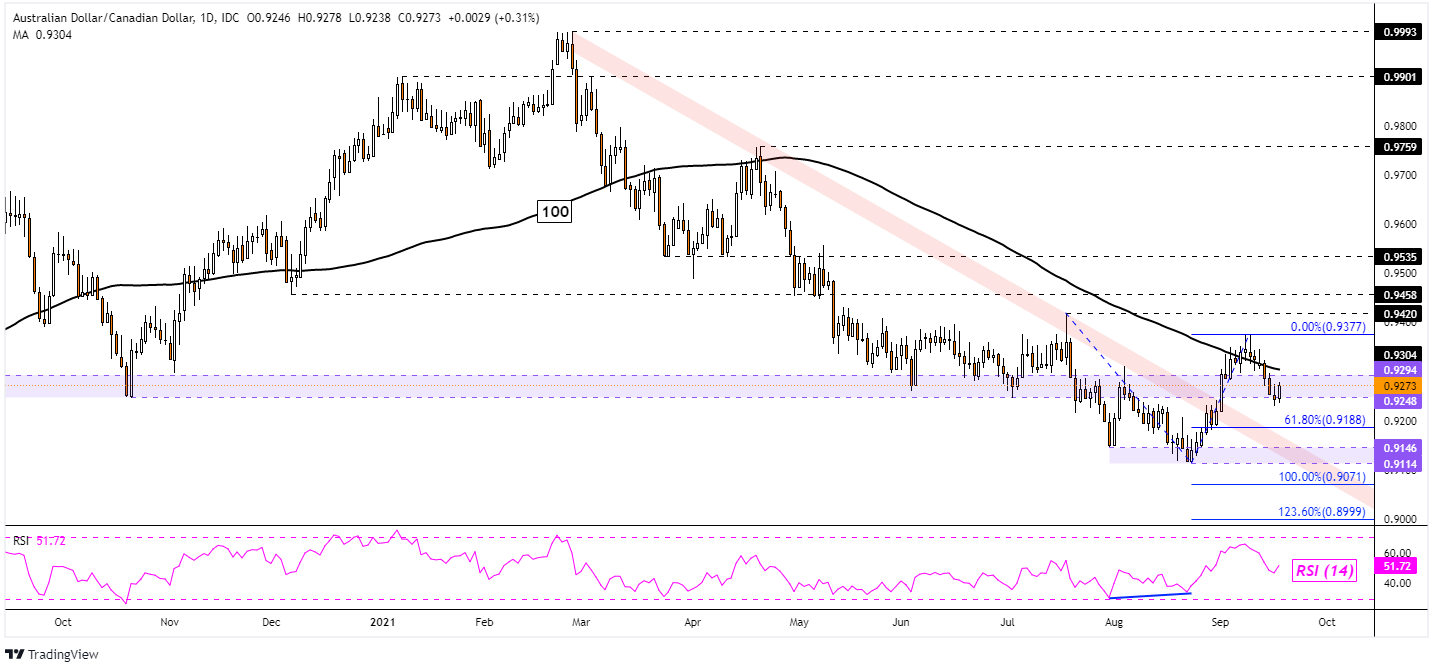
AUD/CAD – Neutral
The Australian Dollar weakened against the Canadian Dollar this past week. This further undermined AUD/CAD’s breakout above a falling trendline from February. Prices ended last week within the familiar 0.9294 – 0.9248 inflection zone. The 100-day SMA seems to be pivoting the pair back lower after new resistance seemed to had been established at 0.9377.
Clearing the inflection zone would expose the 61.8% Fibonacci extension at 0.9188 as the pair makes its way back to the key 0.9114 – 0.9146 support zone. Resuming the downtrend since earlier this year would expose the 100% extension at 0.9071. Otherwise, extending the August bounce may open the door to facing the July high at 0.9420.
--- Written by Daniel Dubrovsky, Strategist for DailyFX.com
To contact Daniel, use the comments section below or @ddubrovskyFX on Twitter


