


British Pound Technical Forecast – Talking Points
- GBP/USD Breaks above triangle support putting the currency pair on a bullish footing
- EUR/GBP stagnates within rangebound trading but a direction shift may be near
GBP/USD Technical Forecast: Bullish
The British Pound tracked higher against the US Dollar last week, gaining over a full percentage point. GBP/USD broke above its 20- and 50-day Simple Moving Averages recently, along with a breakout above the upper bound of a Symmetrical Triangle pattern formed over the last month of trading. Further upside in the currency pair following the breakout may be the path of least resistance.
Major resistance above the triangle is between 1.4000 and 1.4009, which has rejected upward moves earlier this year. Price appears to be testing that limit into the weekend. To the downside – within the triangle – the 38.2% Fibonacci retracement may provide support. The 20-and 50-day Simple Moving Averages would be eyed as intermediate support before the triangle’s lower bound is reached if price breaks back into the triangle formation.
GBP/USD 8-Hour Price Chart
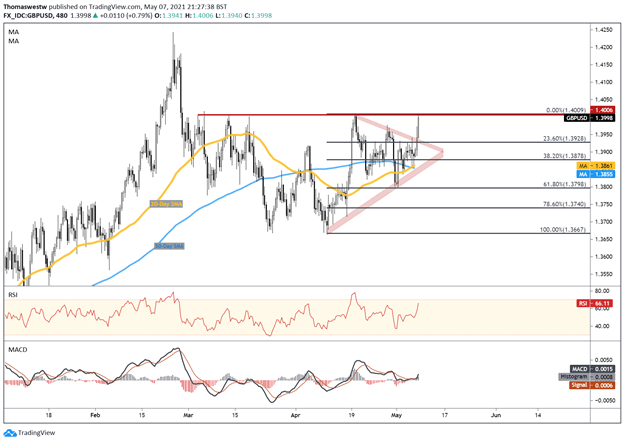
Chart created with TradingView
EUR/GBP Technical Forecast: Neutral
Following the British Pound’s worst monthly performance against the Euro in nearly a year, EUR/GBP is now trending marginally lower this month. Since early April, following the breakout higher, the currency pair has traded largely within the 0.8600 to 0.8711 range. Price may continue to trend within this range, but a break to either side would likely see follow-through.
To the upside, EUR/GBP would face the downward trending 100-day SMA. A break higher would bring a former area of resistance back into focus at the 0.8783 level. Alternatively, a break below the 0.86 handle would first see possible support offered at the 50-day SMA. A level of prior support at the 0.8539 level is the next point under 0.86 that could offer support.
EUR/GBP 8-Hour Chart
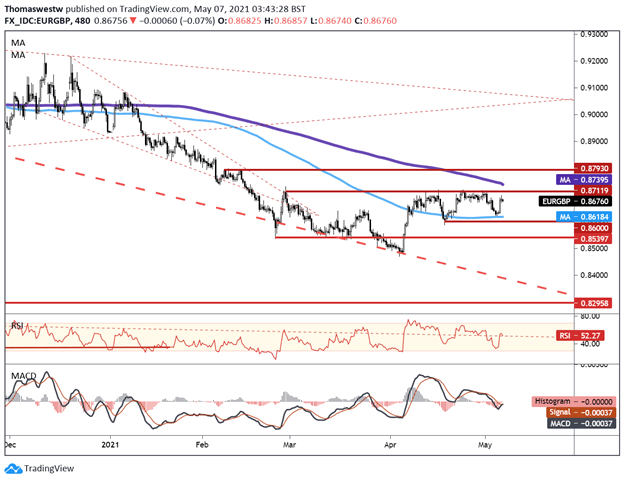
Chart created with TradingView
British Pound TRADING RESOURCES
- Just getting started? See our beginners’ guide for FX traders
- What is your trading personality? Take our quiz to find out
- Join a free webinar and have your trading questions answered
- Subscribe to the DailyFX Newsletter for weekly market updates
--- Written by Thomas Westwater, Analyst for DailyFX.com
To contact Thomas, use the comments section below or @FxWestwater on Twitter


