


Gold Price Technical Outlook:
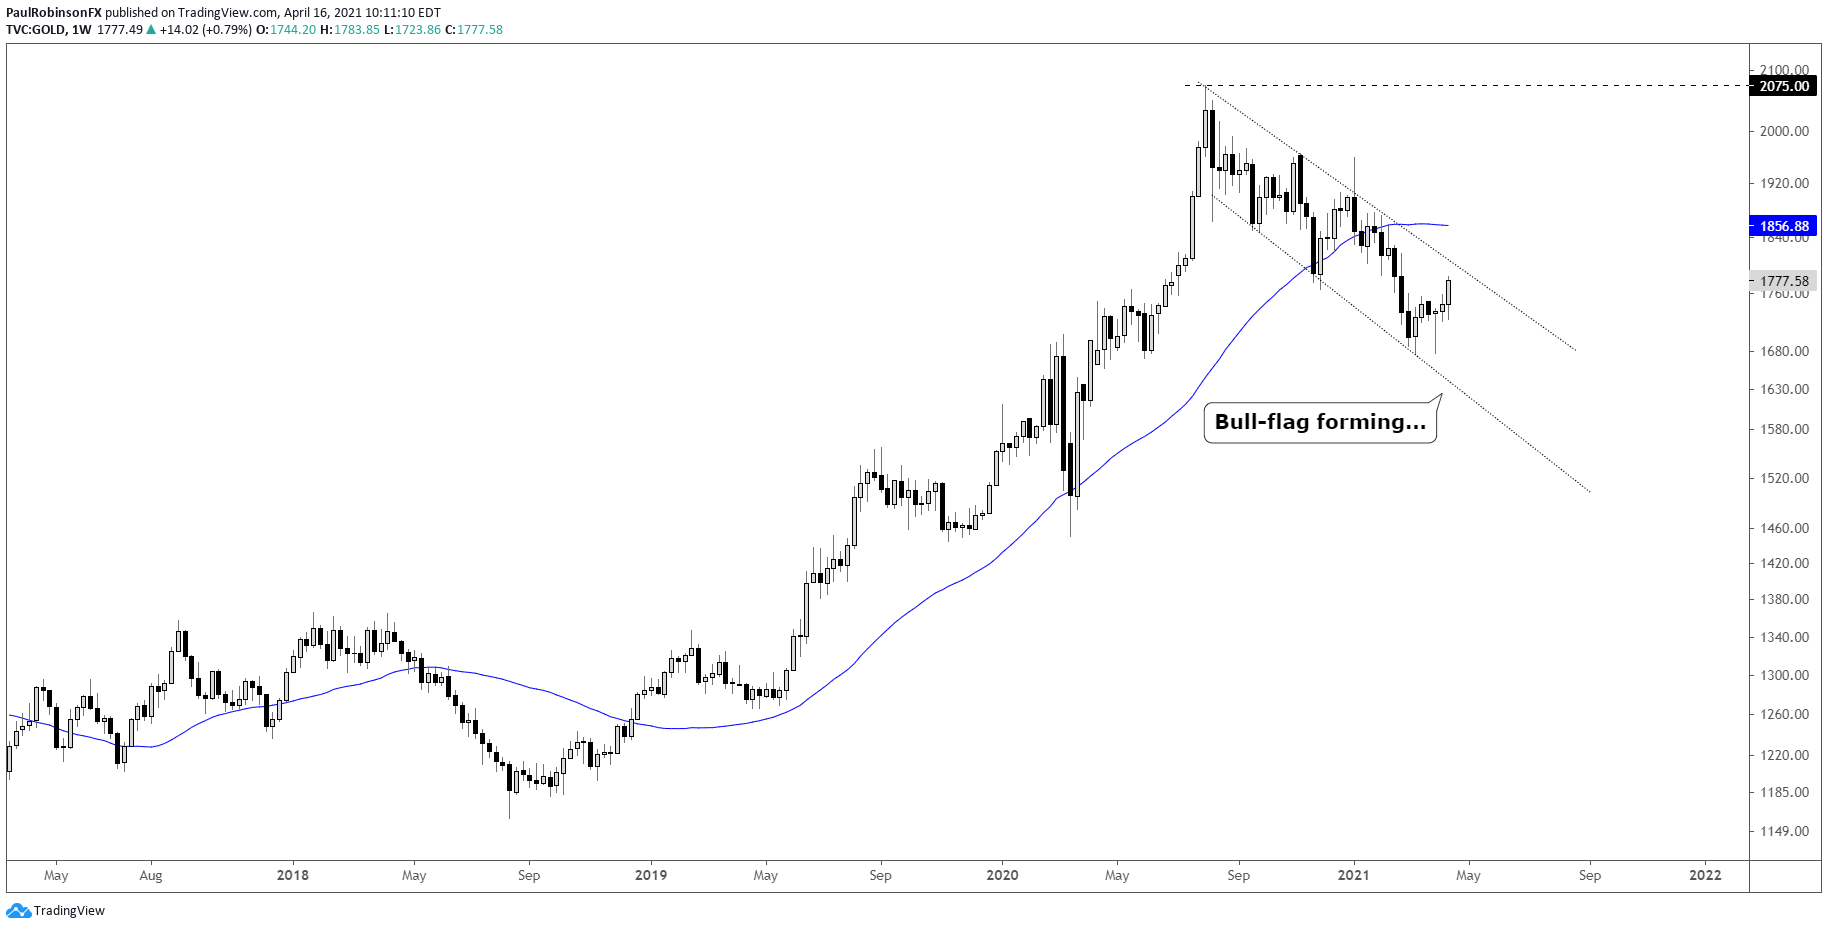
- Gold price working on trading towards top of bull-flag
- This makes near-term outlook bullish
- Long-term outlook tentatively bullish, but outlook improving
Gold Price Forecast – Outlook Growing Increasingly Bullish
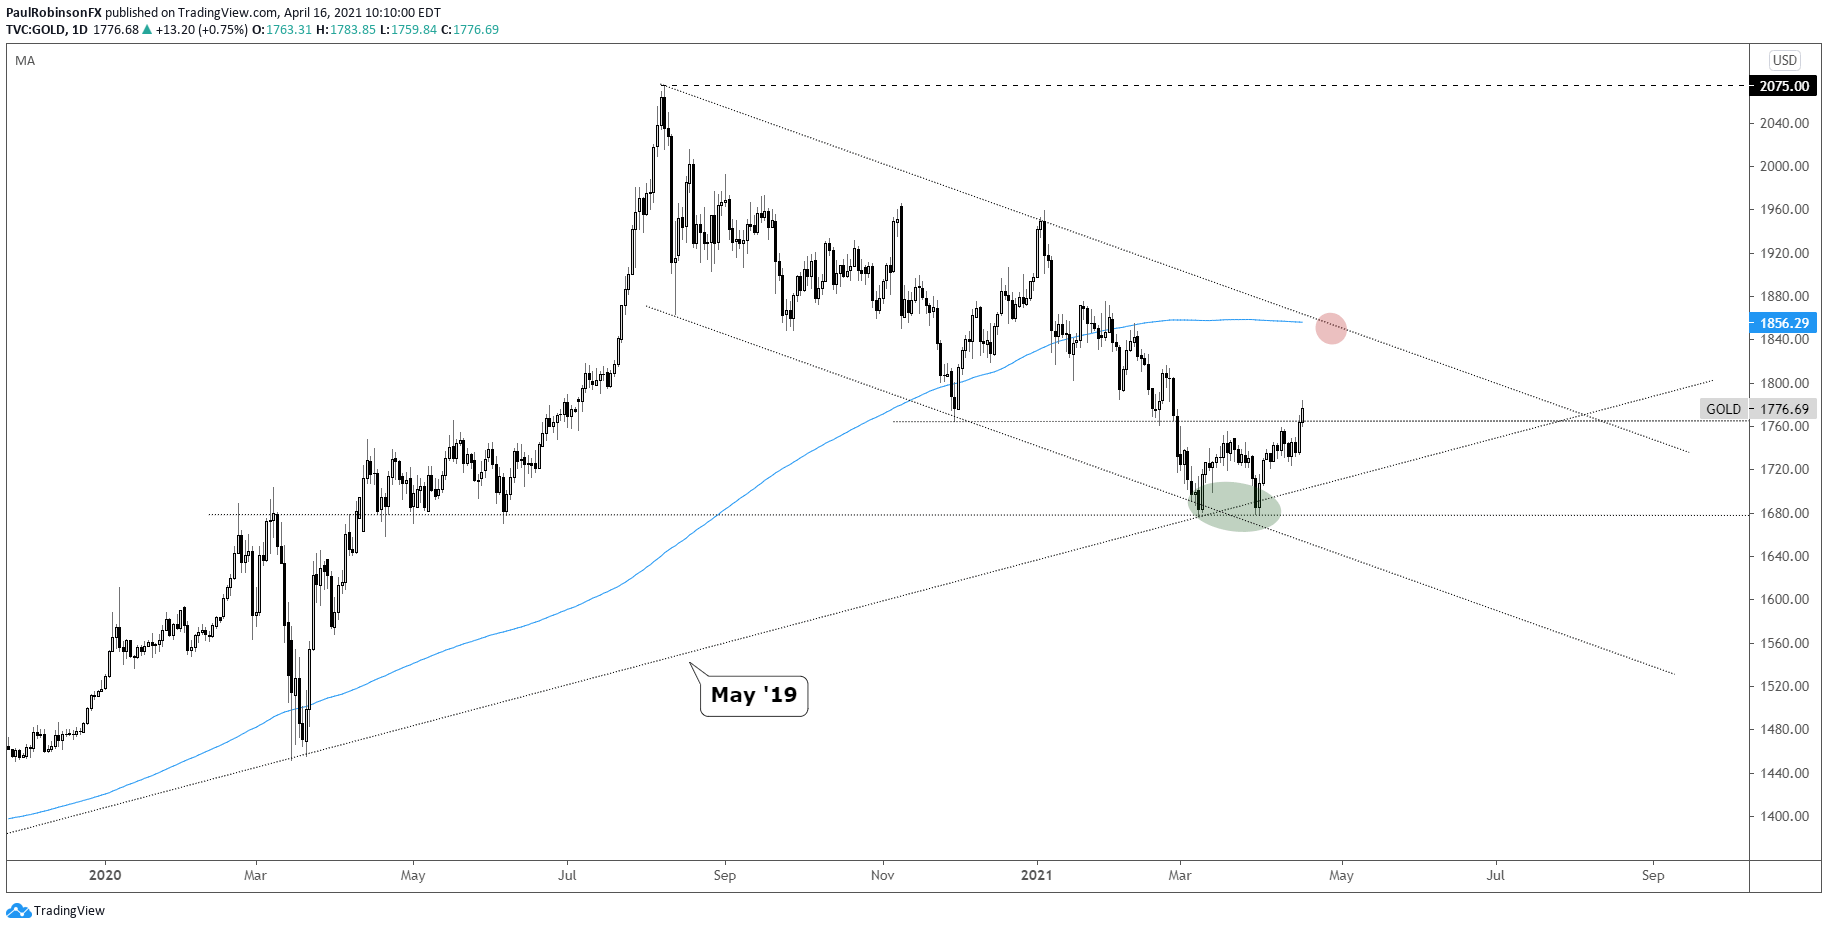
Gold is coming up off confluent support nicely. The May 2019 trend-line and horizontal support from last year helped forge a double-bottom. The first significant level of resistance via the November low at 1764 is being challenged.
A clear break above resistance will leave room for gold to trade to the top-side trend-line of a long-term bull-flag pattern and 200-day moving average. Currently the two are in confluence and should gold arrive to that point it will likely prove to be another very pivotal point. We’ll worry about that should it become relevant.
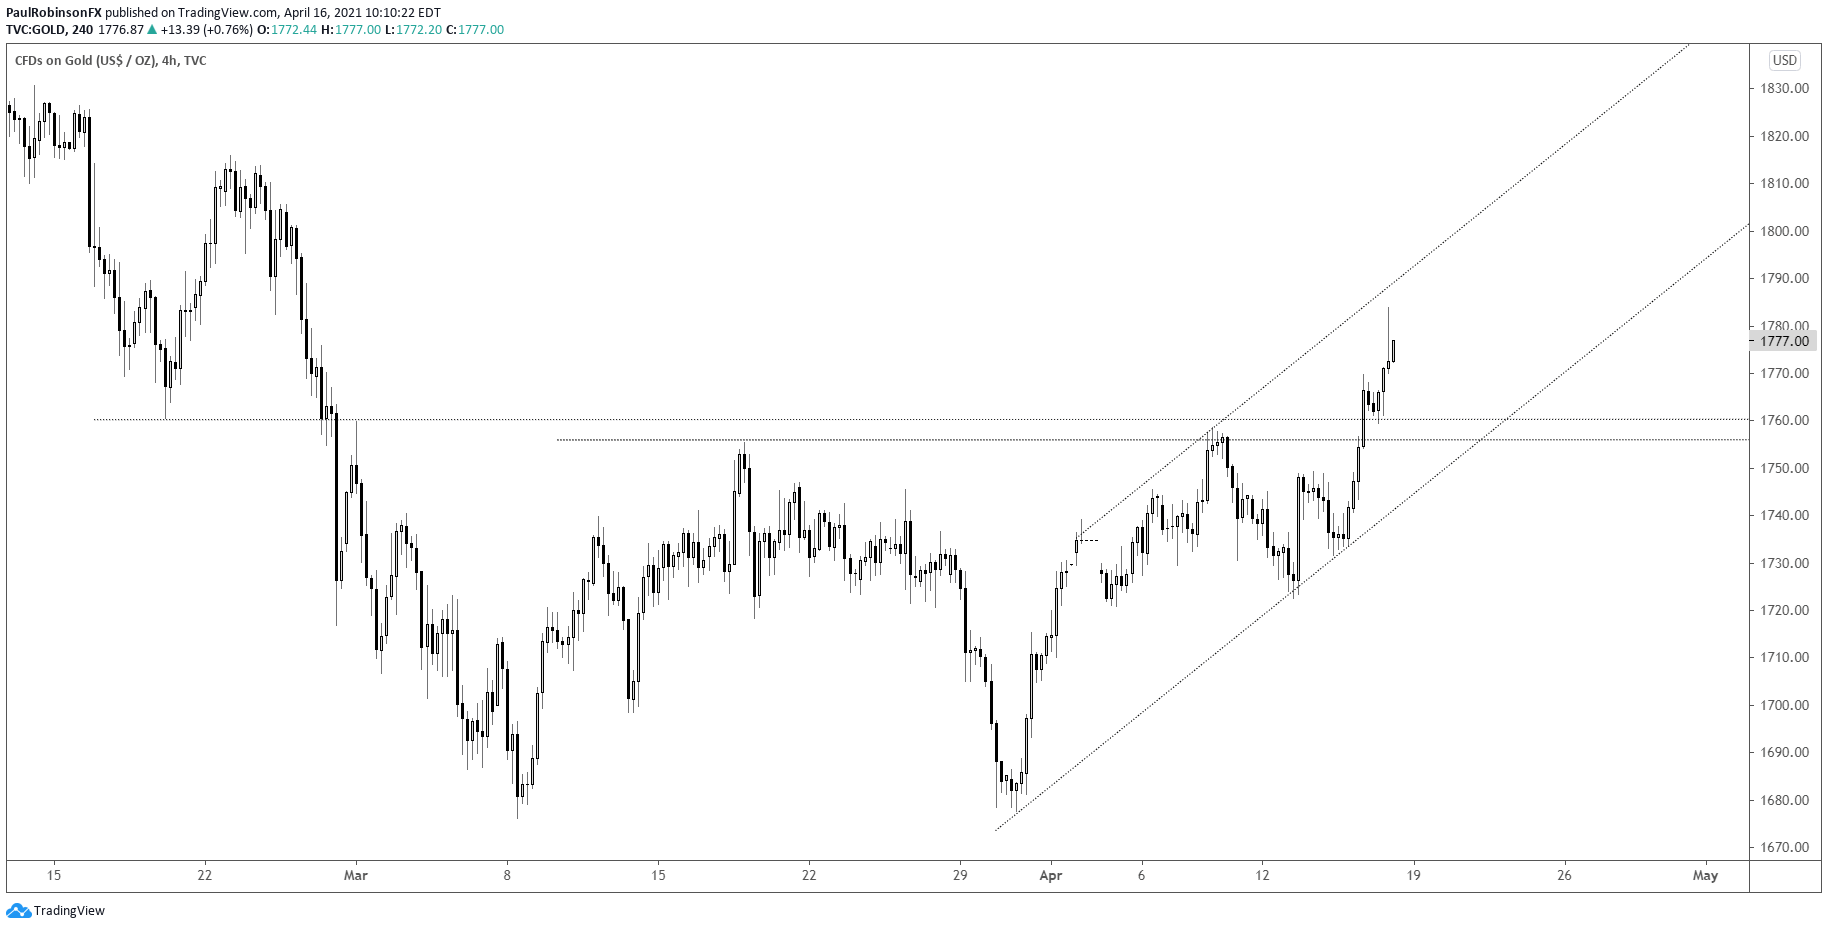
For now, the outlook is shaping up nicely for further gains in the near-term. What we will want to pay attention to is how the channel off the late March low develops. On a pullback, seeing support at 1760/55 and the lower channel line hold will be important.
A dip to either threshold could present a solid risk/reward opportunity for would-be longs. A break below both thresholds may not turn the bias outright bearish, but will at the least be a neutralizer.

Gold Price Weekly Daily Chart (bull-flag)
Gold Price Daily Chart (trying to head to upper parallel)
Gold Price 4-hr Chart (watch channel and horizontal support)
Resources for Forex Traders
Whether you are a new or experienced trader, we have several resources available to help you; indicator for tracking trader sentiment, quarterly trading forecasts, analytical and educational webinars held daily, trading guides to help you improve trading performance, and one specifically for those who are new to forex.
---Written by Paul Robinson, Market Analyst
You can follow Paul on Twitter at @PaulRobinsonFX


