


Dow Jones, DAX 30, FTSE 100 Forecasts: Neutral
- The Dow Jones trades within reach of all-time highs but may be susceptible to shorter-term pullbacks
- The DAX 30 has etched out an ascending channel but looks to enter next week on the backfoot
- After languishing about for months, the FTSE 100 may look to extend its bullish break out
Dow Jones Technical Forecast
Outlook: Bullish but Vulnerable
The Dow Jones continues to display signs of strength, closing Friday’s session mere points from a new all-time high. While the index has seen its gains slow relative to early November, the longer-term outlook for the Industrial Average remains encouraging. That being said, it might be vulnerable to shorter-term pullbacks if the established range is to continue.
Dow Jones Price Chart: 4 – Hour Time Frame (August 2020 – December 2020)
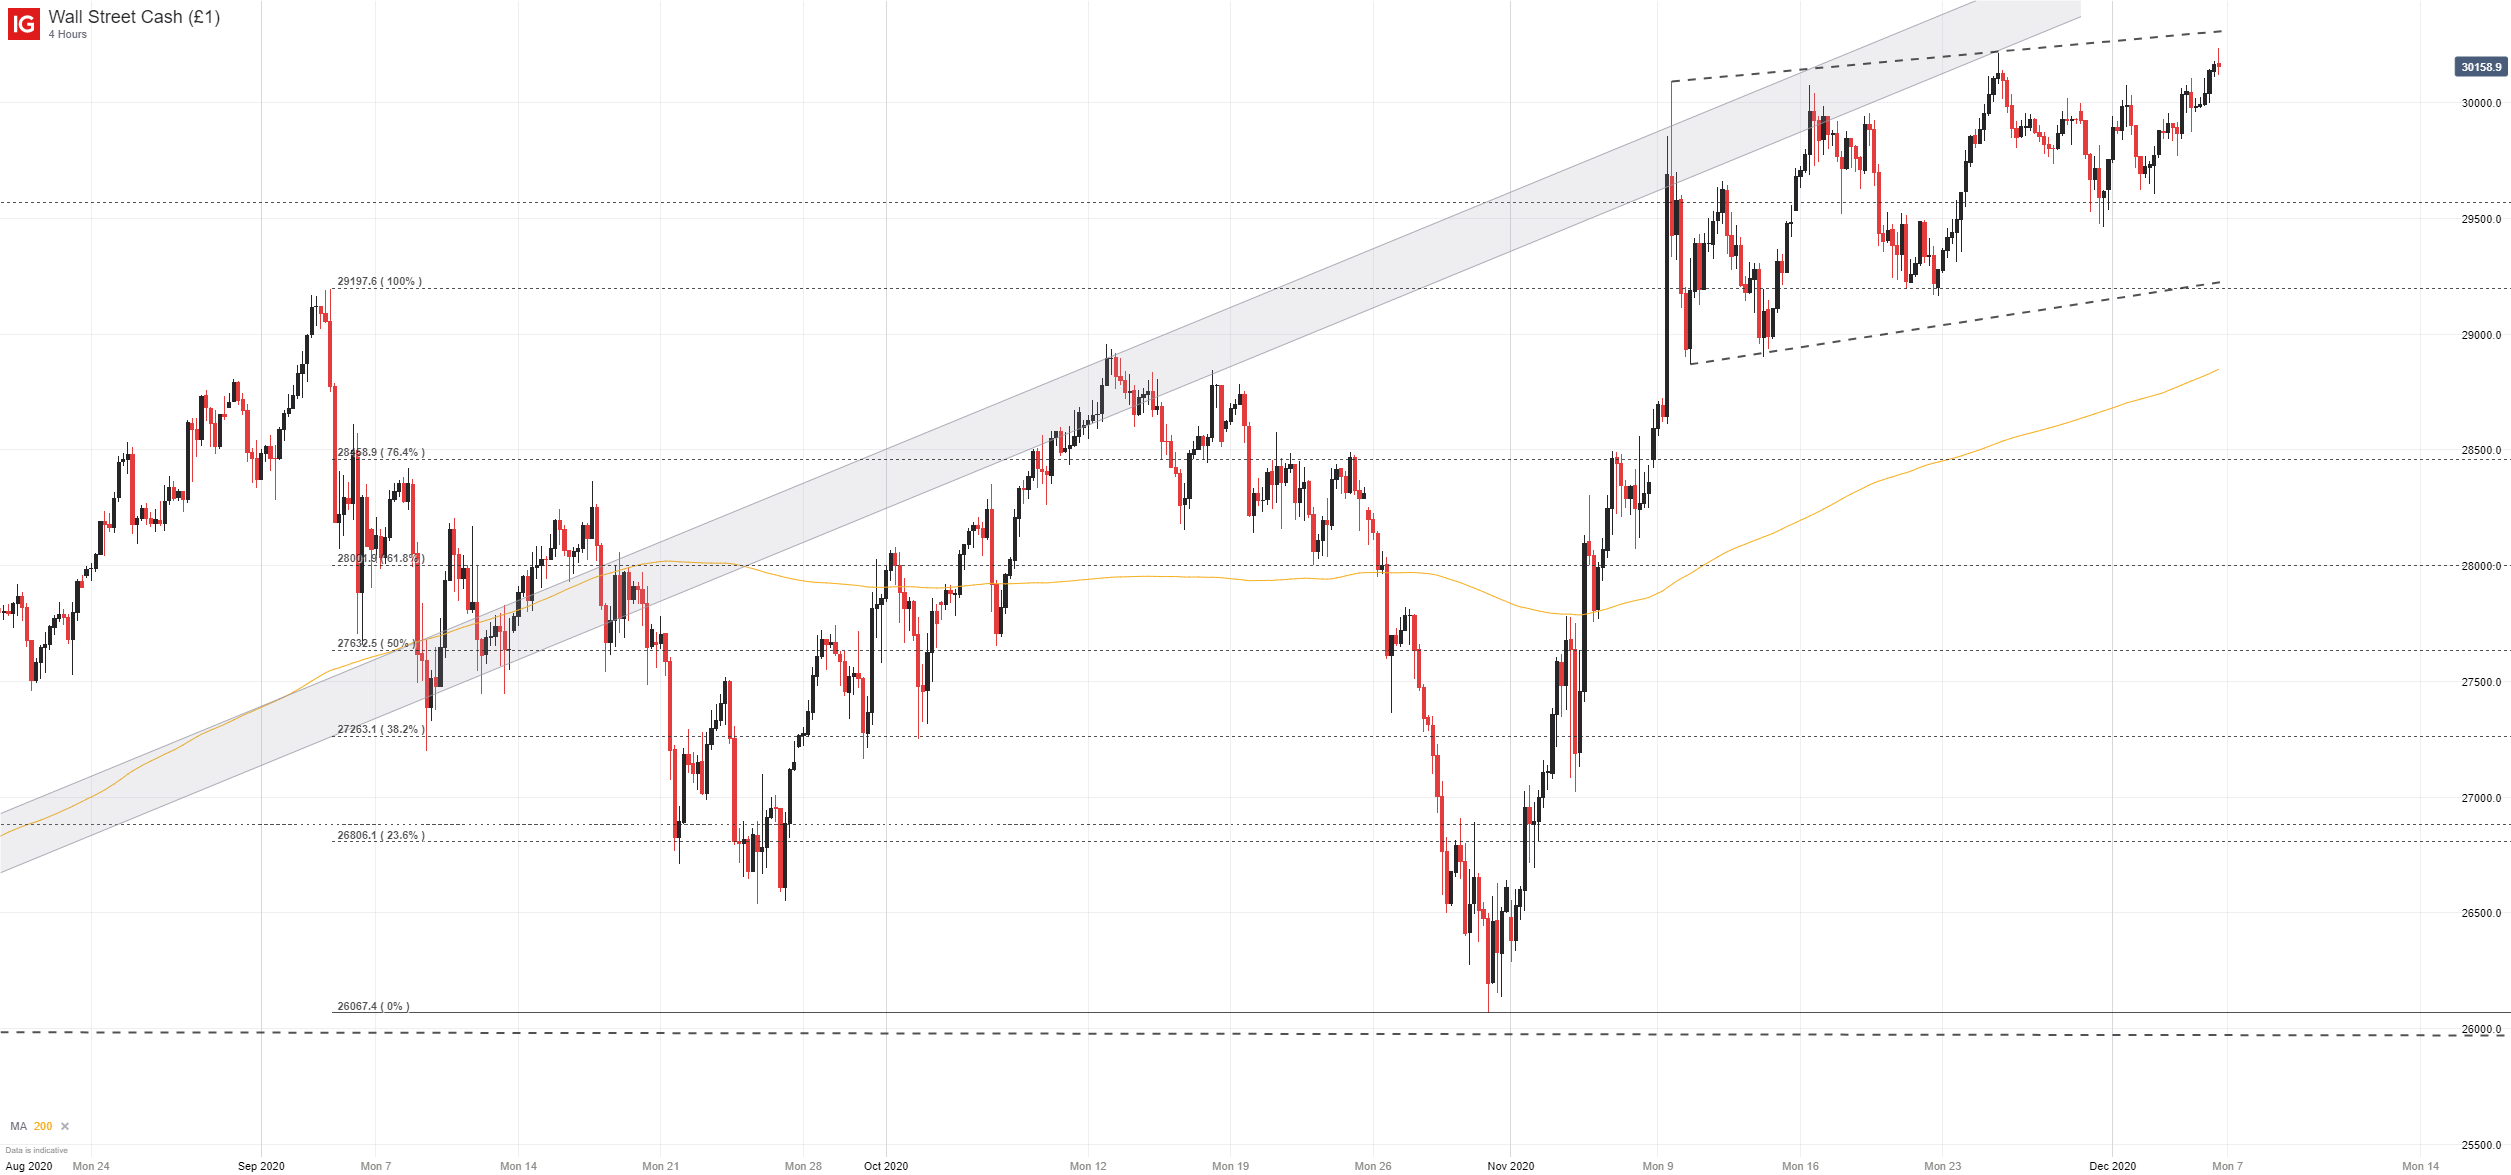
To that end, early resistance might rest along the trendline projection derived from prior all-time highs. Given the line has only two points of contact with price, it is too soon to identify it as a concrete level, but it may work to keep price contained nonetheless. Further still, reaching the level would require the Dow Jones to reach new heights which may provide resistance in and of itself.
Stock Market Holiday Calendar 2020/21
Either way, there is a lot of room beneath price and potential support so if bearishness does materialize, selling could gain steam quite quickly. Thus, one could argue there is more room to the downside at present, but it would mean wagering against an index standing just points from a new record.
DAX 30 Technical Forecast
Outlook: Neutral
The DAX 30 has been trending upward gradually much like the Dow Jones, but recent gains have slowed and the German equity index has approached the lower bound of the ascending channel that has been etched out since early November. Further still, the DAX 30 has been on the backfoot to start December and seems to run the risk of a possible break beneath support.
DAX 30 Price Chart: 4 – Hour Time Frame (September 2020 – December 2020)
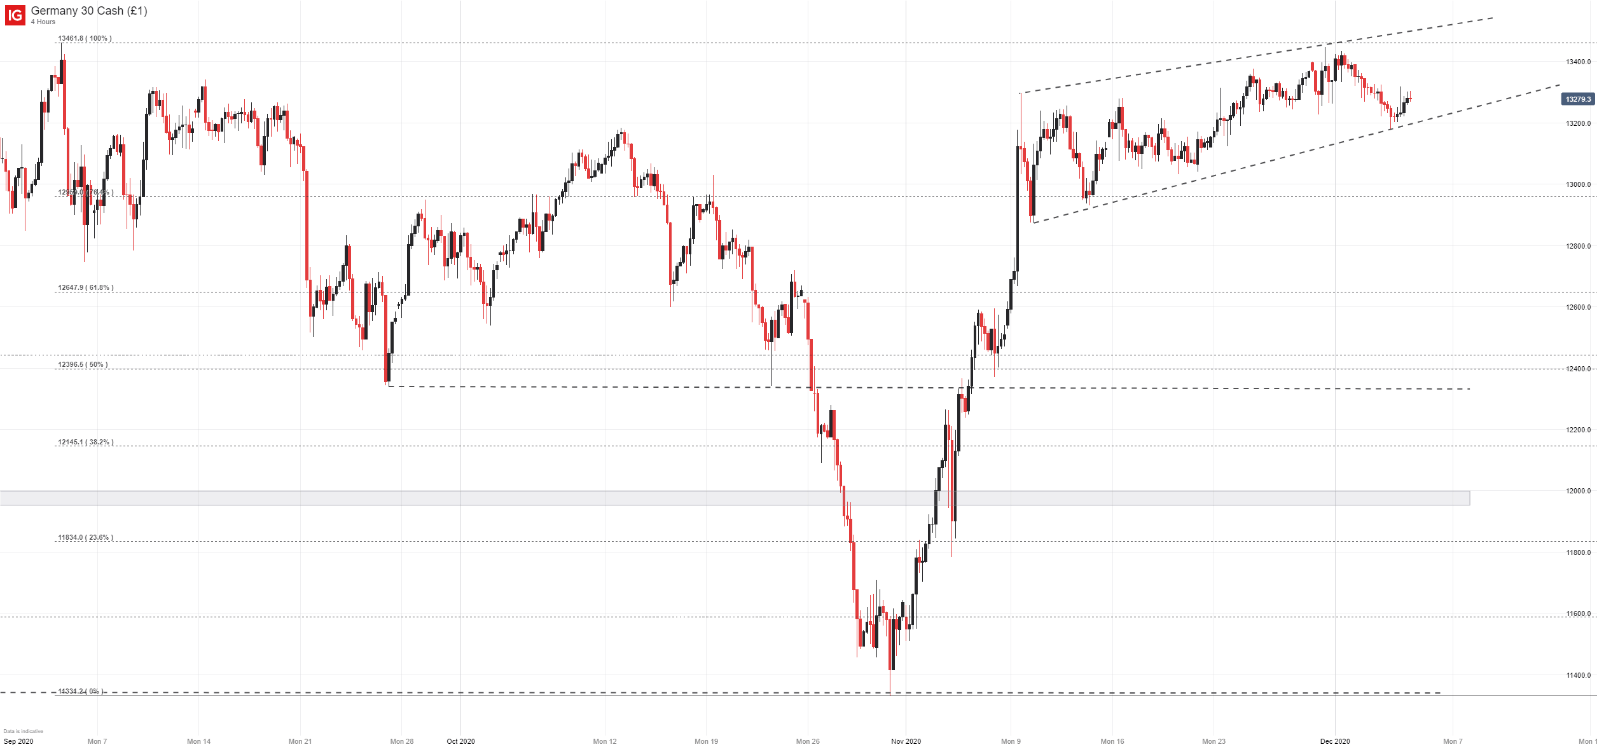
Should the index fall out of the channel, secondary support might reside around the November swing-lows and the Fibonacci level near 12,960. Given that the longer-term trend has been higher, however, the DAX 30 could also look to recapture lost ground within the channel. Since a break has not yet materialized, I would argue range trading strategies might remain optimal at this stage.
If support does fail, strategies that lend themselves to break-outs may become worthy of consideration. In the meantime, follow @PeterHanksFX on Twitter for updates and analysis.
FTSE 100 Technical Forecast
Outlook: Bullish
The FTSE 100 finds itself in an unfamiliar position compared to the last eight months as it looks to be on the verge of a bullish break out. After bleeding lower for much of 2020, the index shot higher throughout November and has continued gains to start December. Taking out the May swing high around 6,517 in Friday trade is the most recent symptom of bullish interest in my opinion.
FTSE 100 Price Chart: Daily Time Frame (December 2018 – December 2020)
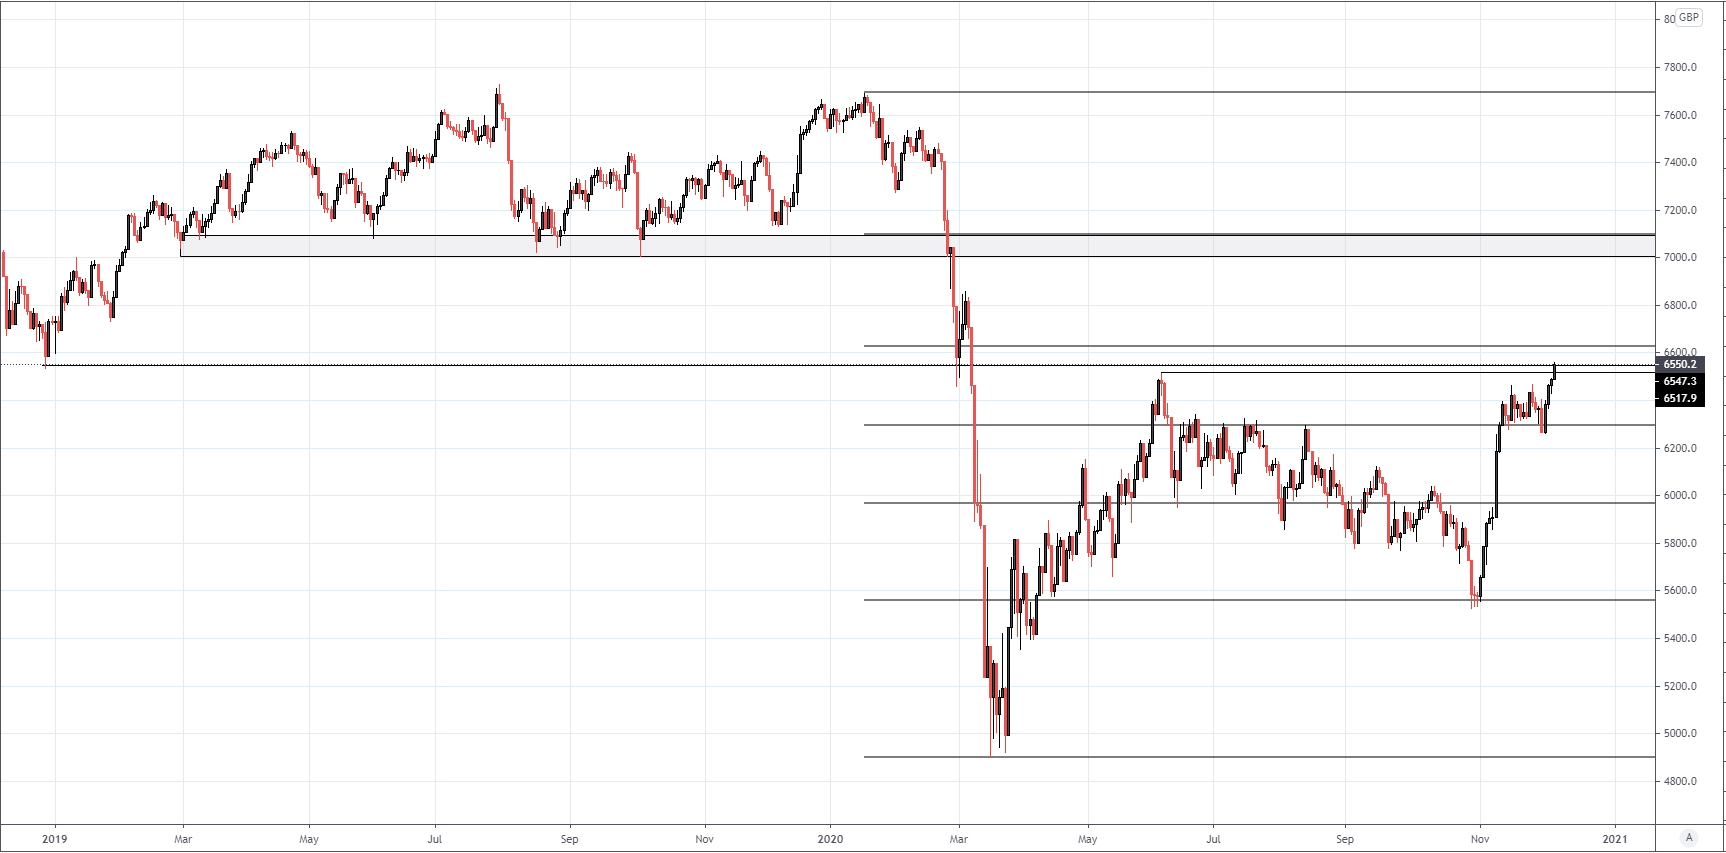
Chart created with TradingView
The FTSE 100 closed Friday at 6,550, a level that coincides with the December 2018 low and could offer influence in the week ahead. With the two prior highs nearby, the FTSE 100 could look to employ prior resistance as support going forward and effectively use them to springboard higher should bullish appetite persist.
Subsequent resistance might reside at the Fibonacci level just north of 6,600 and again near 7,000. In the event of a larger pullback, the Fibonacci level around 6,295 might offer buoyancy.
--Written by Peter Hanks, Strategist for DailyFX.com


