


Gold Technical Week Ahead Forecast: Neutral
- Sideways trade as bulls and bears continue to battle.
- A range break may be building up.
Gold in a Short-Term Rut
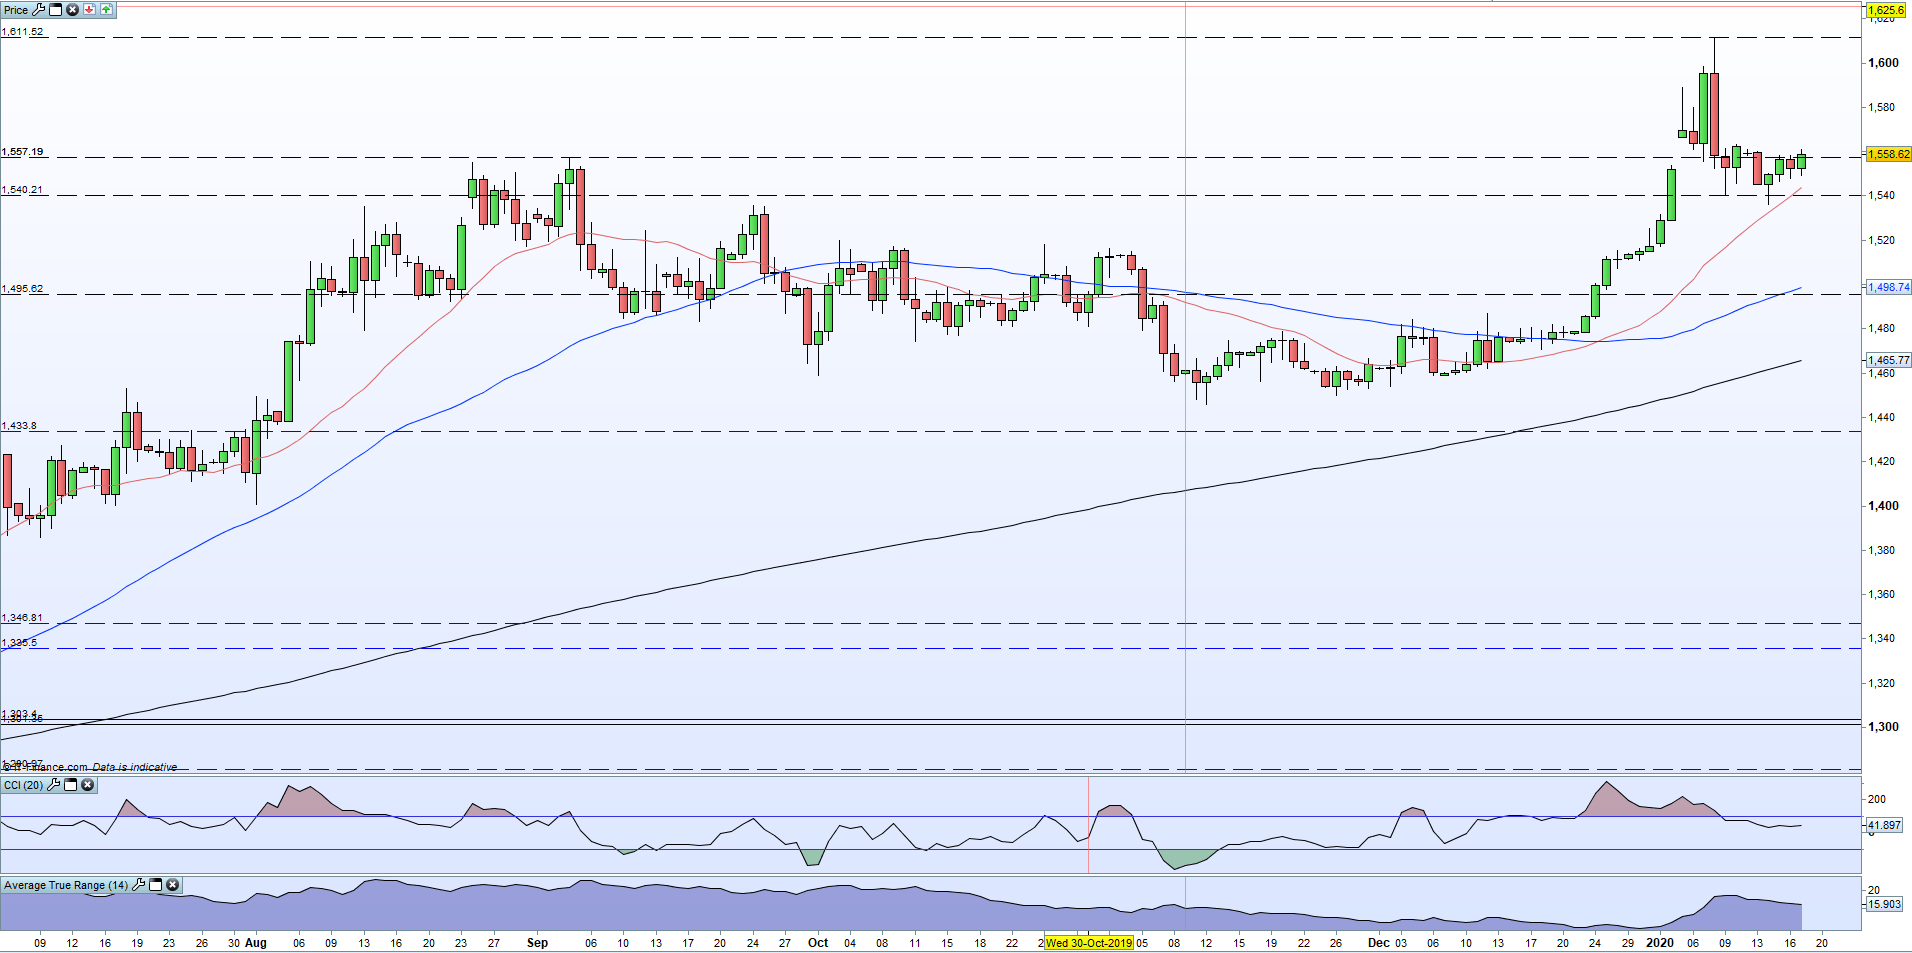
It’s been a few weeks since gold traders could justifiably complain about being in an uninspiring market but this week the precious metal has been stuck in a narrow trading range, albeit with a slight upward bias. Tight trading ranges never last for long and normally preceed a sharp breakout, in either direction. The daily and weekly price charts however have something for both bulls and bears, adding to the market indecision.
Gold opened the week around $1,558/oz. before hitting a $1,536/oz. low on Tuesday and then recovering. As I write, the precious metal is changing hands around $1,558/oz. again, leaving gold flat on the week. The week consists of two down days and three up days with the last three sessions seeing gold trade between $1,545/oz. and $1,560/oz.
The daily chart does suggest the potential for further upside with gold now trading above all three moving averages, although the CCI indicator is neither overbought or oversold and gives nothing away. If gold moves back into the body of the January 8 bear candle, a move back towards $1,580/0z. and $1,590/0z. may ensue.
Downside protection is between $15,42/oz. and $1,536/oz. and gold may need a strong fundamental stimulus to break and close these levels next week. To keep in touch with all market moving events and data releases you can use the DailyFX Calendar.

Gold Daily Price Chart (July 2019 - January 17, 2020)
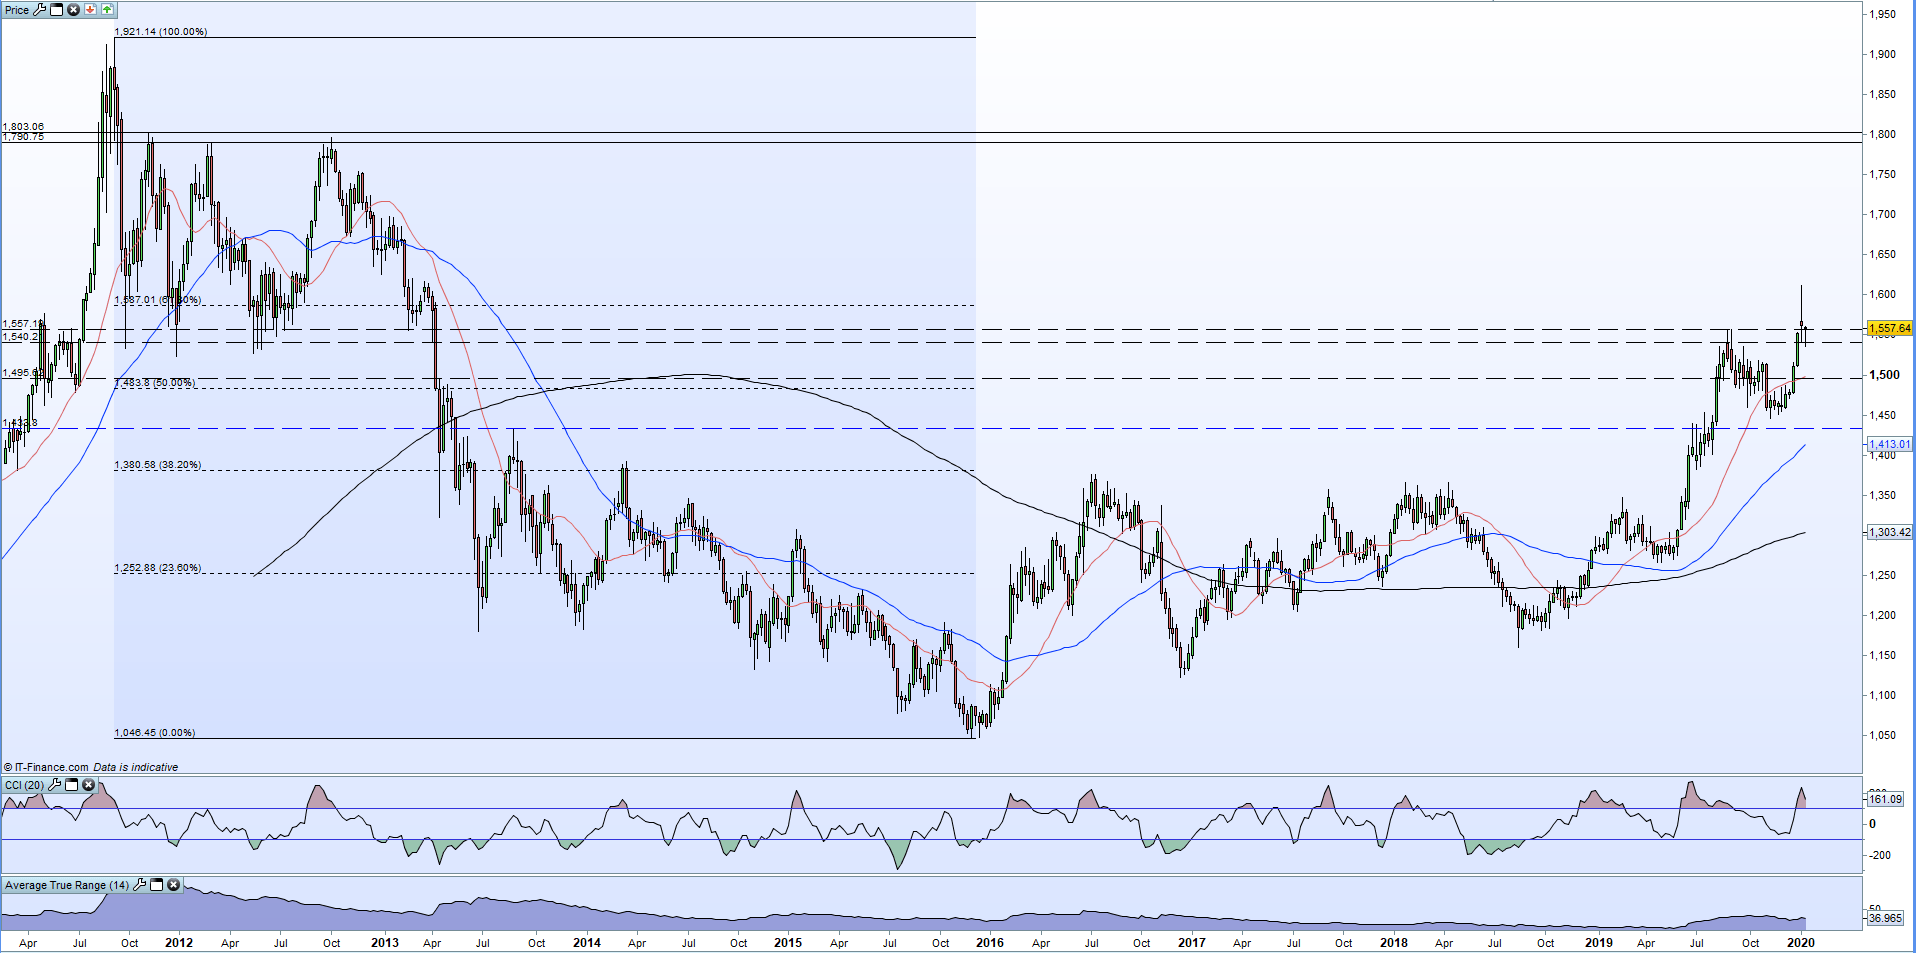
A look at the weekly gold chart shows an important Fibonacci retracement level around $1,587/oz. and this again may draw be a short-term target for buyers to chase. The weekly chart also shows a bearish reversal hanging man candle being formed and if next week’s candle is also negative, then gold may be entering a period of lower prices.
Gold Weekly Price Chart (April 2011 – January 17, 2020)

Traders may be interested in two of our trading guides – Traits of Successful Traders and Top Trading Lessons – while technical analysts are likely to be interested in our latest Elliott Wave Guide.
What is your view on Gold – bullish or bearish?? You can let us know via the form at the end of this piece or you can contact the author at nicholas.cawley@ig.com or via Twitter @nickcawley1.


