


Dow Jones, Nasdaq 100 & DAX 30 Forecasts:
- The Dow Jones broke higher in November and could look to extend recent gains with the help of prior resistance
- The DAX 30 has consolidated over the last two weeks, a development I had long argued was necessary before continuing higher
- Learn the different facts and opportunities when trading the Dow Jones, Nasdaq and S&P 500
Dow Jones Forecast
Outlook: Bullish
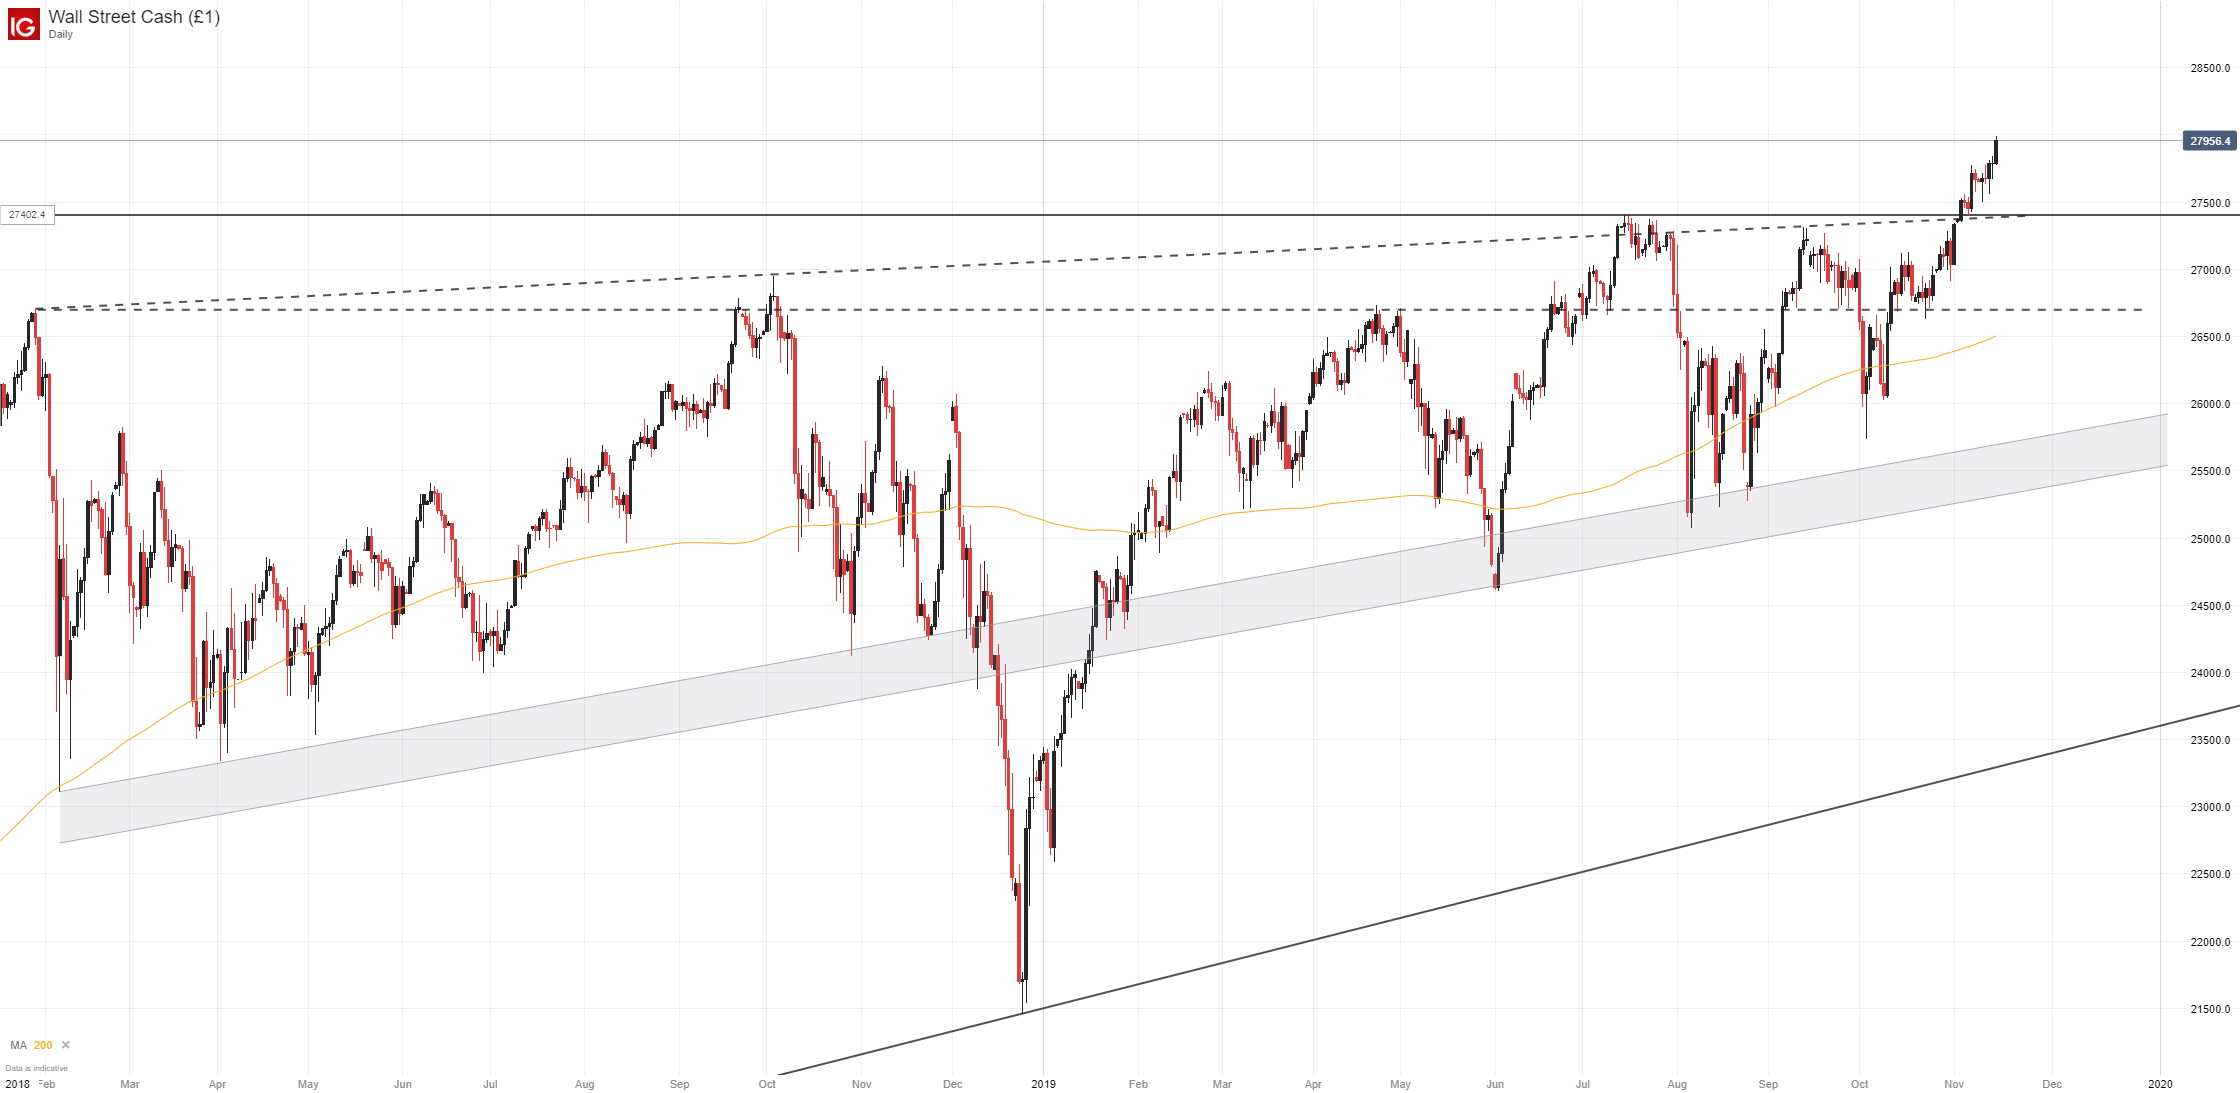
The Dow Jones continued its rally last week, closing above 28,000 for the first time in history. After breaking higher earlier this month, technical barriers have been sparse and the fundamental landscape accommodative – allowing for an extended run. Looking ahead, the Dow can now look to enjoy support in areas where it previously faced resistance.
Dow Jones Price Chart: Daily Time Frame (February 2018 – November 2019) (Chart 1)
Day Trading the Dow Jones: Strategies, Tips & Trading Signals
To that end, the DJIA could enjoy potential support around the 27,500 level which marks the highs established in July and September earlier this year. Subsequent support could come into the fold around the psychologically significant 27,000 level before horizontal support at 26,700 is needed – but such a retracement would likely require a serious fundamental shift.
Nasdaq 100 Forecast
Outlook: Bullish
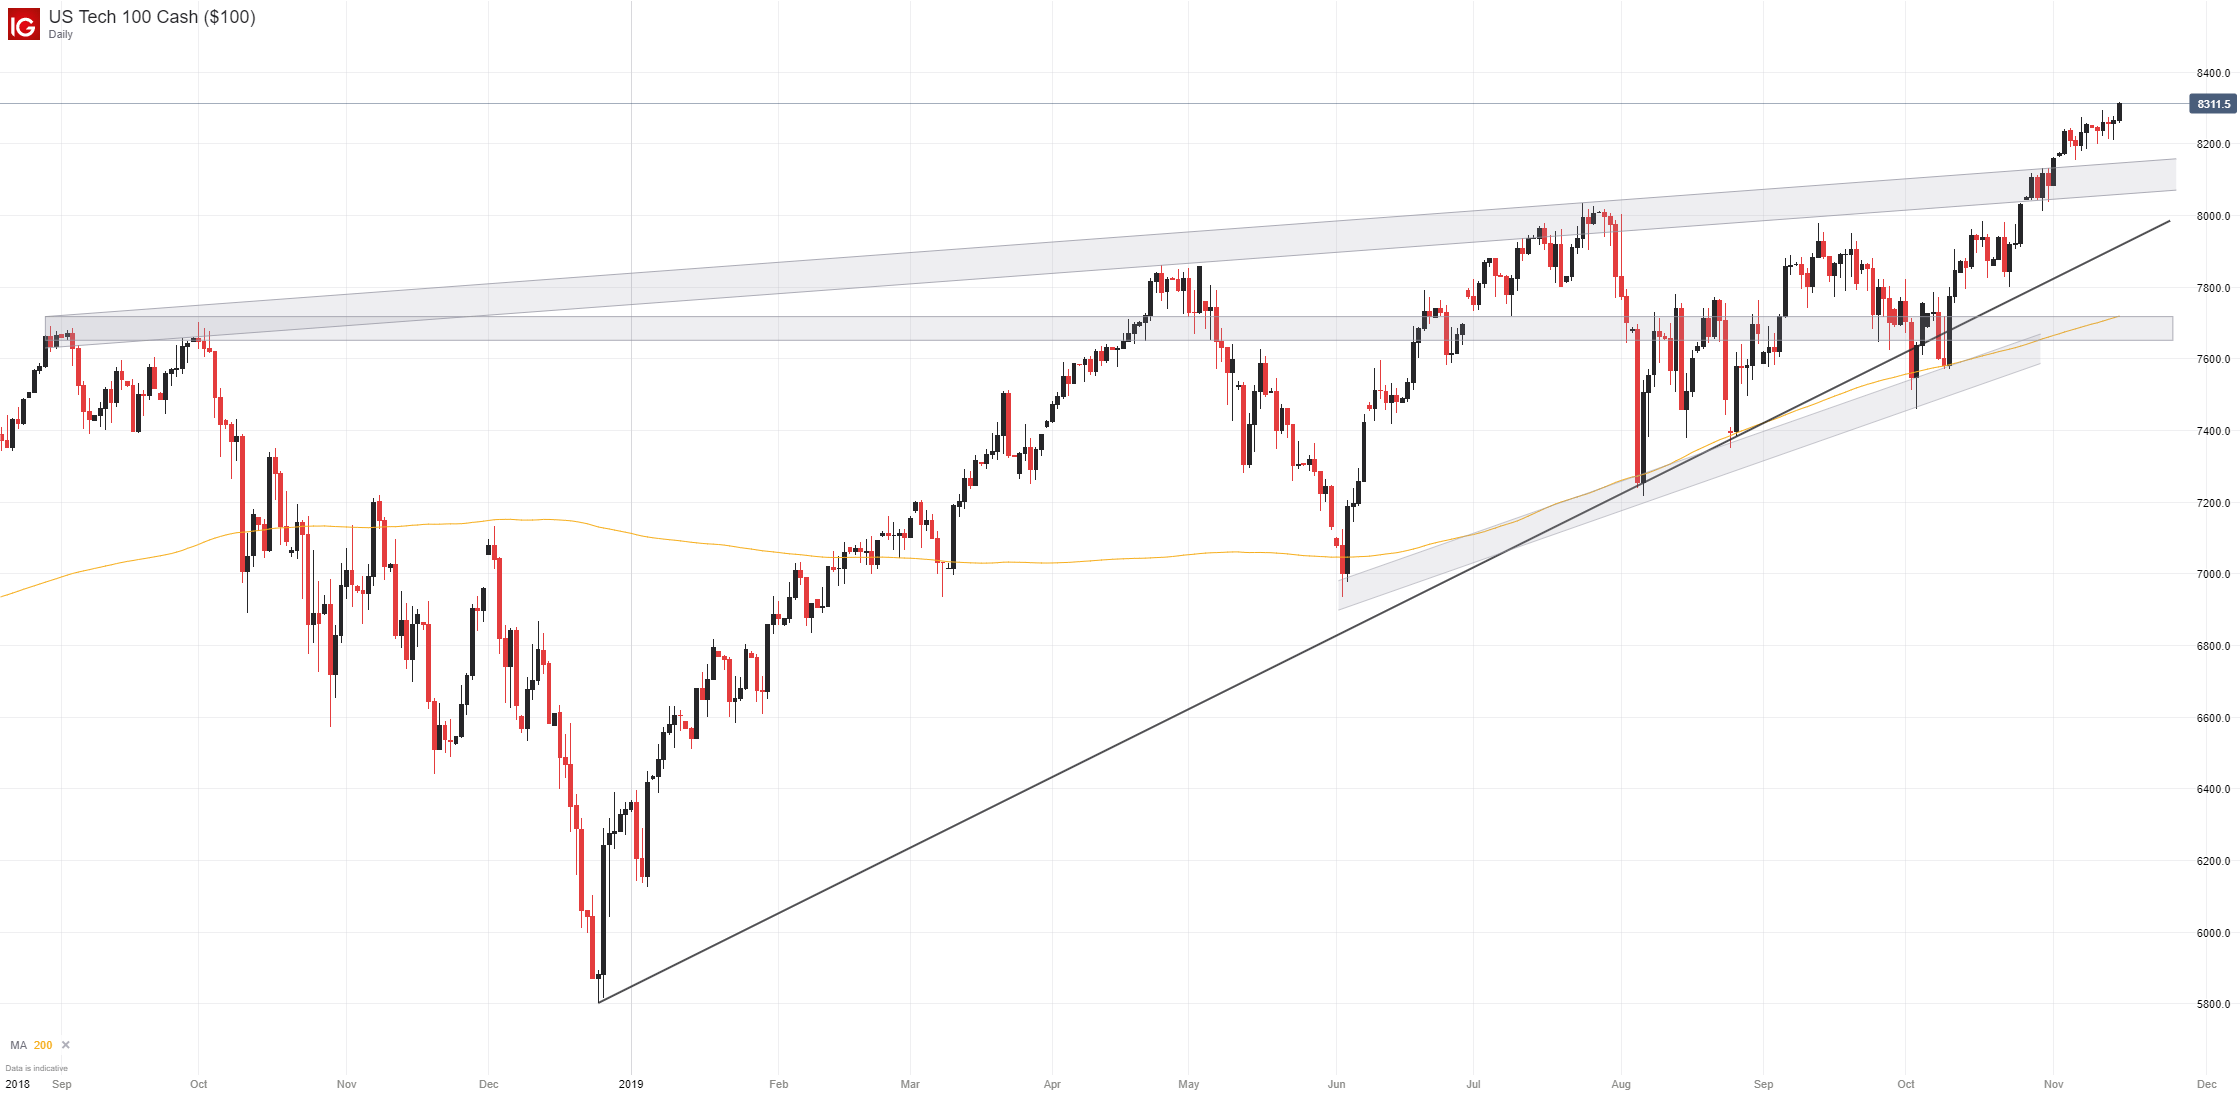
The Nasdaq 100 has surged alongside its blue-chip counterpart, establishing record levels of its own. Perhaps unsurprisingly then, the technical backdrop of the two US indices is somewhat similar. Topside resistance is sparse without previous price action to offer its influence and prior barriers have morphed into potential areas of buoyance. Thus, the ascending band from September 2018 around 8,175 will be an area to watch in the event the tech-heavy index turns lower in the week ahead.
Nasdaq 100 Price Chart: Daily Time Frame (September 2018 – November 2019) (Chart 2)
DAX 30 Forecast
Outlook: Bullish
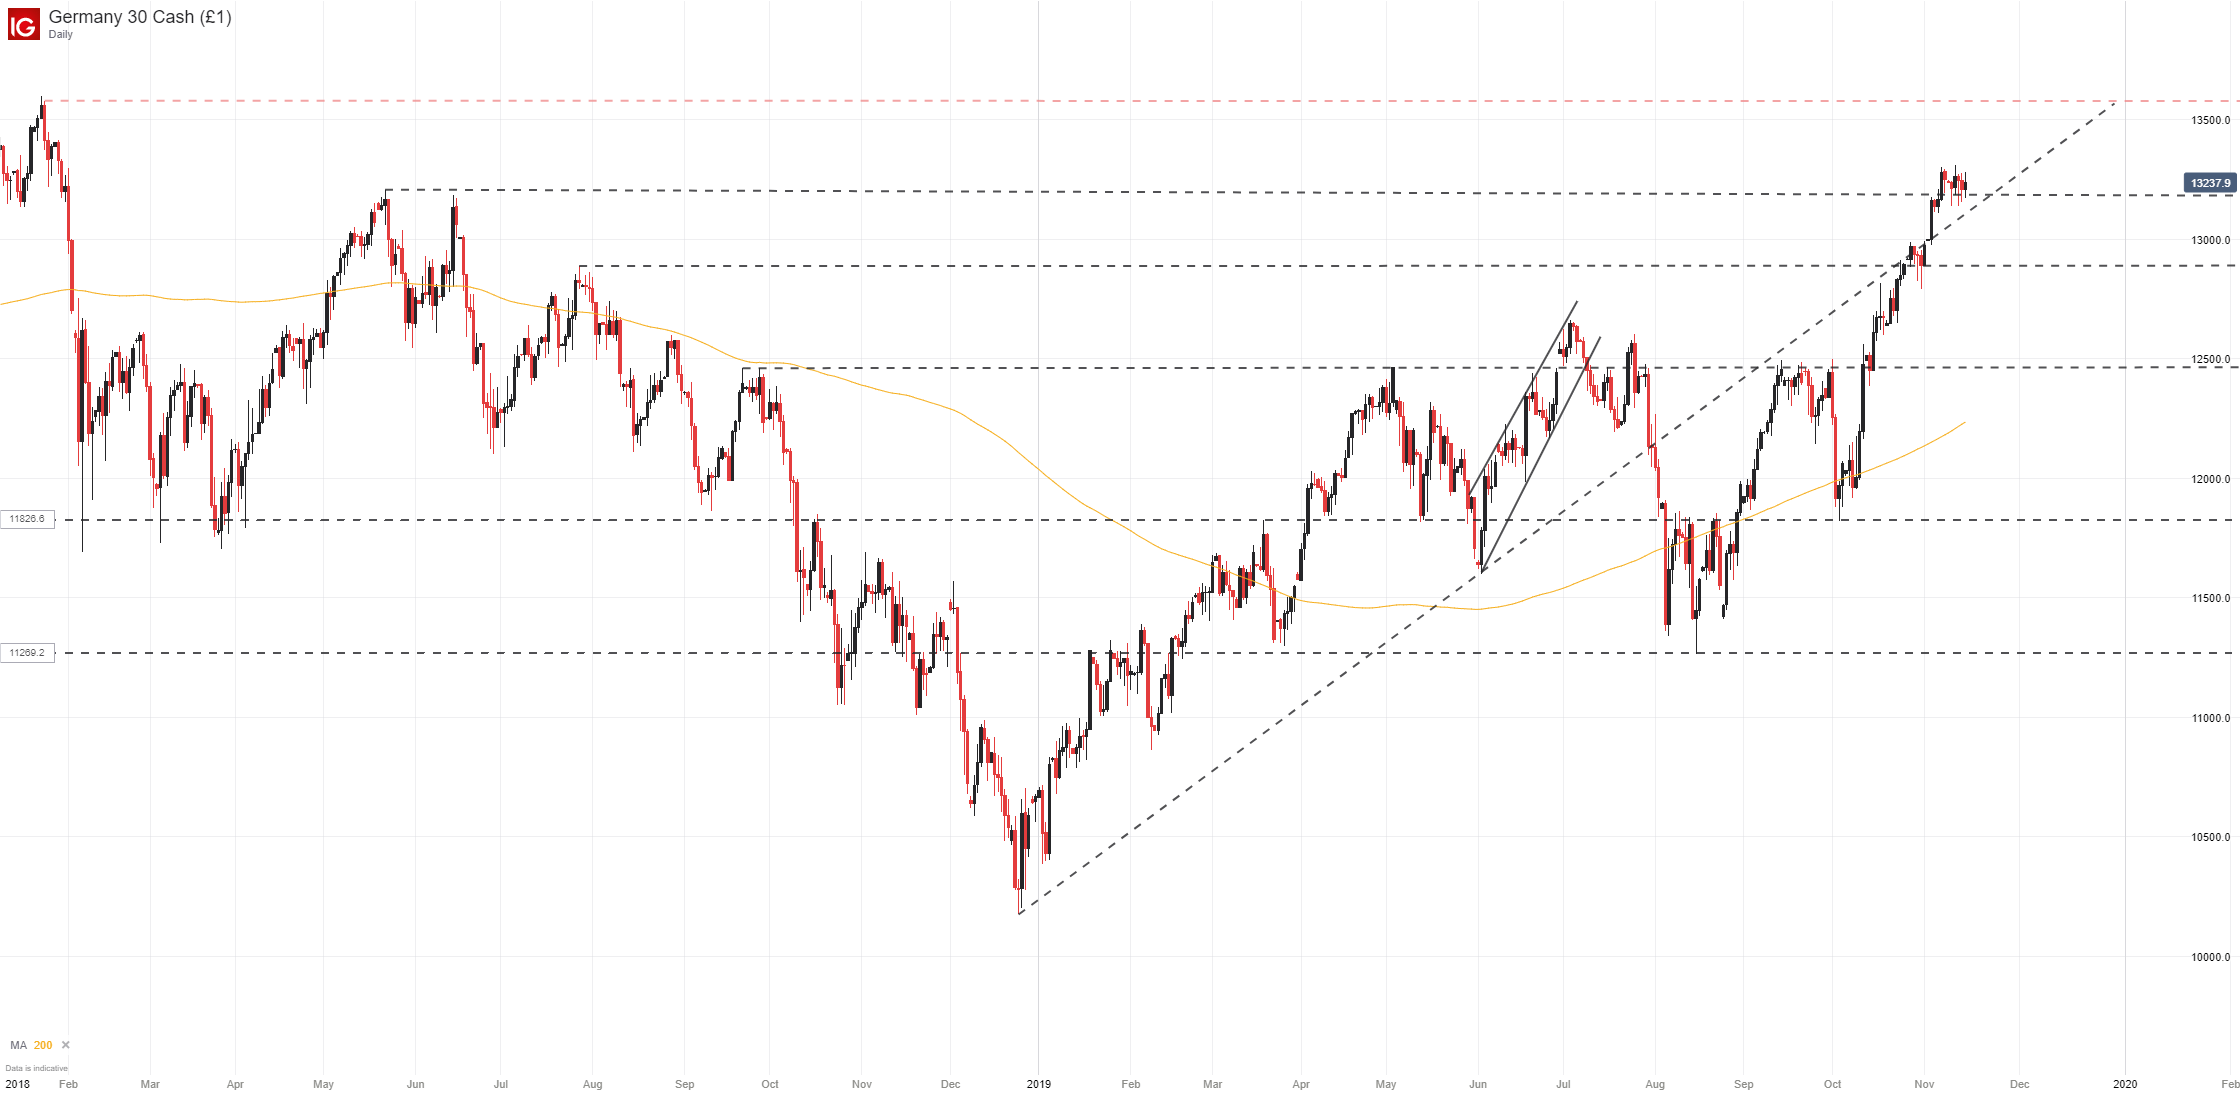
Similarly, the DAX 30 has climbed to lofty levels of its own. After surging higher since late August, the German equity index has seemingly stopped to catch its breath, a development I had argued was necessary before further gains can be attempted.
DAX 30 Price Chart: Daily Time Frame (February 2018 – November 2019) (Chart 3)
How to Trade the Dax 30: Trading Strategies and Tips
With that in mind, the DAX may now turn its sights higher once more. Enjoying two-fold support around 13,190 which has helped provide a cushion for consolidation, the ascending trendline from December could carry the DAX 30 to highs from January 2018 around 13,500. Thus, 13,500 is the level to watch in the event of a bullish continuation while a break beneath confluent support could see the index seek secondary support around 12,900. In the meantime, follow @PeterHanksFX on Twitter for further updates and analysis.
--Written by Peter Hanks, Junior Analyst for DailyFX.com
Read more: CAC 40 & Euro Stoxx 50 Outlooks Enjoy Boost from Auto Tariff Deadline


