


Talking Points:
- USD/JPY trading above the 102 handle in early London trading hours
- Yen weakness follows Shinzo Abe’s election win and the possibility of further stimulus
The USD/JPY is trading above the 102 handle (at the time this report was written) after the pair saw a surge higher following the results of the upper house election in Japan. Prime Minister Shinzo Abe won a supermajority in the chamber, which might imply further easing by the BoJ down the line.
Looking ahead, a quiet economic calendar puts the spotlight on Fed-speak by Kansas City Fed President Esther George. Comments could potentially help clarify Fed uncertainties following the “Brexit” vote and give clues on the future rate path.
Taking this into consideration, we look to find short term trading opportunities using the Grid Sight Index (GSI) indicator.
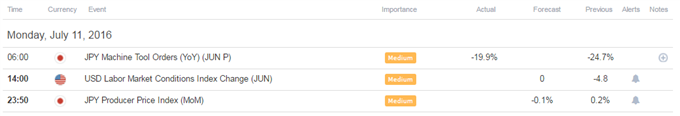
Click Here for the DailyFX Calendar
A quiet economic calendar might imply that market focus may still be in digestion mode of the weekend’s Japan elections and Friday’s NFPs. The Significant beat to expectations in the US payroll data saw a surge higher in risk assets that appears to have had follow through when Asian trade opened. Combined with the possibility of further easing measures by the BoJ on the Shinzo Abe win, the USD/JPY saw a surge higher.
Kansas City Fed President Esther George is set to speak at 14:00 GMT and might provide comments regarding the Fed’s rate path. The market didn’t meaningfully pull forward rate hike bets following Friday’s NFPs, which might imply that rate hikes are being priced out on the backdrop of the global environment, which appears likely to be, at least in part, a result of the “Brexit” vote. Any comments by George on rates which clashes with that narrative might see further US Dollar strength.
USD/JPY 5-Min GSI Chart: July 11, 2016
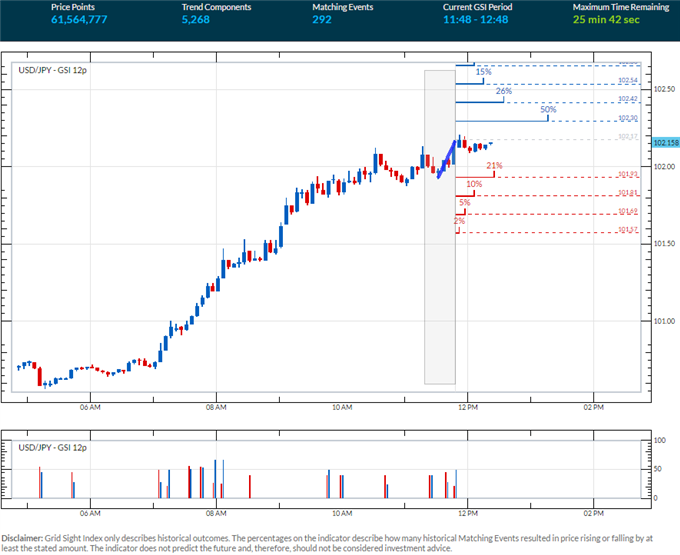
The USD/JPY has managed to break above the 102 handle, and the GSI indicator shows that 50% of similar past momentum events have seen continued upside movements. The GSI indicator calculates the distribution of past event outcomes given certain momentum patterns, and can give you a look at the market in a way that's never been possible before, analyzing millions of historical prices in real time. By matching events in the past, GSI describes how often the price moved in a certain direction.
You can learn more about the GSI here.
USD/JPY Technical Levels:

Click here for the DailyFX Support & Resistance tool
We use volatility measures as a way to better fit our strategy to market conditions. USD/JPY 1-week implied volatility is at 1.50, the lowest of all major pairs. The figure has seen a significant decline today which could be on the backdrop of the major event risk that are now in the rearview mirror, and the subsequent move higher in ”risky assets”. In turn, this may imply that range bound trades are preferable in the short term.
USD/JPY 30-Min Chart: July 8, 2016
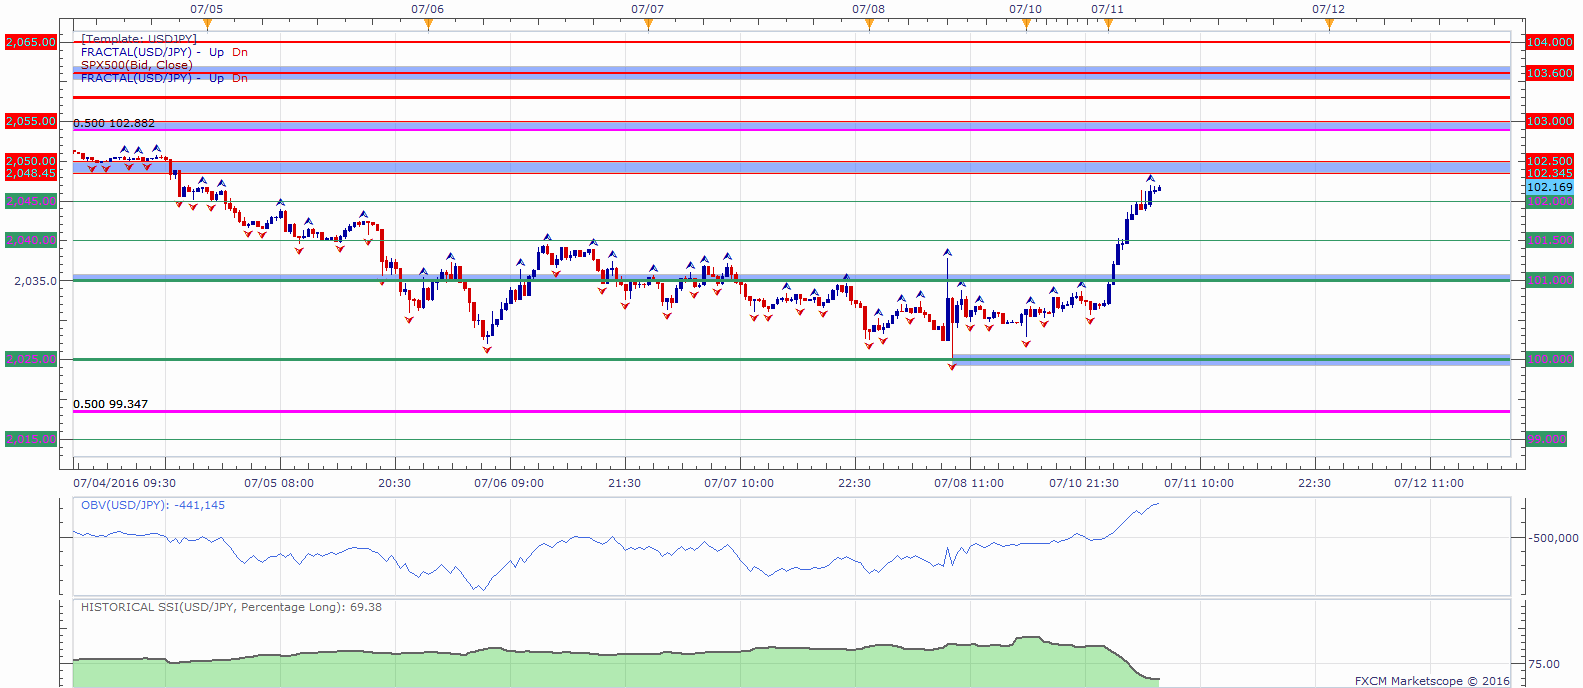
The USD/JPY might find initial resistance in an area below the 102.500 figure to 102.345. Further possible resistance levels might be a zone around the 103 handle, 103.300, 103.600 and the 104 handle.
Levels of potential support on a move lower may be the 102 handle followed by 101.500, 101.000 and the big 100 figure.
When price reaches those levels, short term traders might use the GSI to view how prices reacted in the past given a certain momentum pattern, and see the distribution of historical outcomes in which the price reversed or continued in the same direction. We generally want to see GSI with the historical patterns significantly shifted in one direction, which could potentially be used with a pre-determined bias as well.
A common way to use GSI is to help you fade tops and bottoms, and trade breakouts. That’s why traders may want to use the GSI indicator when price reaches those specific pre-determined levels, and fit a strategy that can offer a proper way to define risk. We studied over 43 million real trades and found that traders who do that were three times more likely to turn a profit. Read more on the “Traits of Successful Traders” research.
Meanwhile, the DailyFX Speculative Sentiment Index (SSI) is showing that about 69.3% of traders are long the USD/JPY at the time of writing. Retail traders were extremely net long and on the wrong side of the entire down move before hitting an extreme reading of about 84% long this Friday. Longs have been reduced quite substantially following this latest move higher.
You can find more info about the DailyFX SSI indicator here
--- Written by Oded Shimoni, Junior Currency Analyst for DailyFX.com
To contact Oded Shimoni, e-mail oshimoni@dailyfx.com


