


Gold Price (XAU/USD), Chart, and Analysis
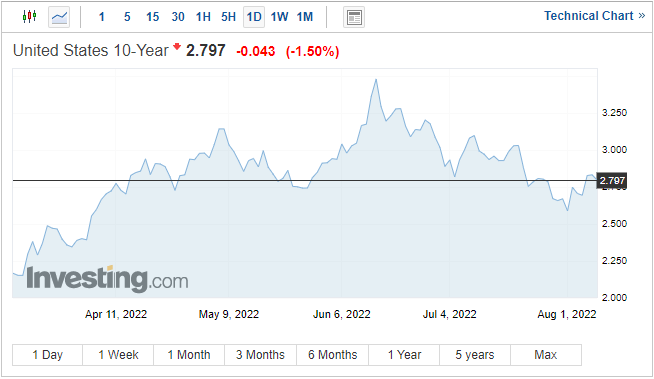
- 10-year US Treasury yields nudge lower.
- The US inflation report is the next important economic release.

Gold starts the week pretty much unchanged from Friday’s closing levels with the precious metal changing hands around $1,775/oz. Friday’s out-sized US NFP release (+528k new jobs vs. +250k expectations) sent gold tumbling and stopped the recent rally in the precious metal in its tracks. Gold has added over $100/oz. since July 21 as longer-dated US Treasury yields tumbled on growing recession fears. The closely watched UST2/10s yield spread is currently quoted around minus 40 basis points, a strong clue from the fixed income market that a recession is on the way in the US, whatever definition is used.
Trade Smarter - Sign up for the DailyFX Newsletter
Receive timely and compelling market commentary from the DailyFX team
For all market-moving data releases and events, see the DailyFX Economic Calendar.
On Wednesday, the latest look at US inflation will be released for the month of July. Core inflation, y/y, is expected to nudge 0.2% higher to 6.1%, while headline inflation is seen 0.4% lower at 8.7%, according to market estimates.
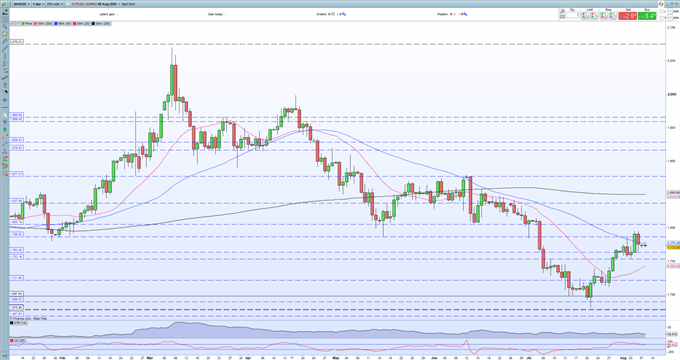
The recent uptick in gold cannot disguise that the precious metal still remains in a downtrend off the March 2022 high. The series of lower highs and lower lows remain in place, while in the short-term the $1,795/oz. double top will be tough to break pre-US inflation. Short-term support is seen at $1,763/oz. and $1,753/oz.
Gold Daily Price Chart – August 8, 2022
Retail trader data show 81.02% of traders are net-long with the ratio of traders long to short at 4.27 to 1. The number of traders net-long is 0.17% higher than yesterday and 11.23% lower from last week, while the number of traders net-short is 3.29% higher than yesterday and 17.82% higher from last week.
We typically take a contrarian view to crowd sentiment, and the fact traders are net-long suggests Gold prices may continue to fall. Yet traders are less net-long than yesterday and compared with last week. Recent changes in sentiment warn that the current Gold price trend may soon reverse higher despite the fact traders remain net-long.
| Change in | Longs | Shorts | OI |
| Daily | -14% | 12% | -2% |
| Weekly | -8% | 13% | 2% |
What is your view on Gold – bullish or bearish?? You can let us know via the form at the end of this piece or you can contact the author via Twitter @nickcawley1.


