


- DAX 40:Edges Lower as Eurozone Inflation Hits New All-Time-High.
- FTSE 100:Flip-Flops Between Gains and Losses as UK PMI Declines.
- DOW JONES:Down as Risk Aversion Boosts Havens and Bonds.
Trading Strategies and Risk Management
Global Macro
Recommended by Zain Vawda
DAX 40: Edges Lower as Eurozone Inflation Hits New All-Time-High
The Dax traded lower in early European trade before recovering some losses as we head toward the US market open. There was some good news early in the session with Eurozone manufacturing PMI coming in at 52.1 in June, down from 54.6 in May, but falling by less than expected. The German equivalent figure came in at 52.0, in line with expectations with the region’s manufacturing powerhouse still in expansion territory
Eurozone inflation hit a new all-time high this morning. The unwanted rise in inflation will continue to keep the pressure on the European Central Bank (ECB) to hike interest rates aggressively in the coming months.
Europe meanwhile seems to be the epicenter of this summer’s global travel woes with France suspending 17% of all flights at Charles De Gaulle airport as employees strike. Airports across Europe are suffering disruption, with hubs in London, Amsterdam and Frankfurt scrapping swathes of flights amid a labor shortage and workers elsewhere walking out as they seek higher pay in the face of spiraling inflation.
The sectoral breakdown is not pretty as red dominates with real estate and information technology posting losses of 7.5% and 6.2% respectively.
DAX 40 Daily Chart- July1, 2022
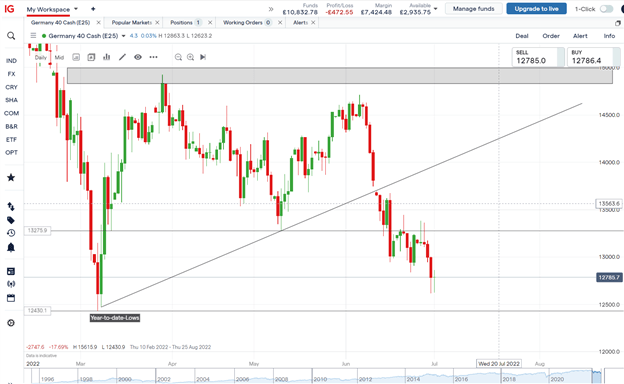
Source: IG
From a technical perspective, yesterday we maintained below the key psychological 13000 level. We approached year-to-date lows before bouncing around the 12600 area retesting the psychological level.
Thursday’s daily candle finally closed below the 13000 level. Should this level hold, it could offer a solid sell-the-rally opportunity for would-be shorts with the year-to-date low as the next viable downside target.
Key intraday levels that are worth watching:
Support Areas
- 12600
- 12430
- 12031
Resistance Areas
- 13000
- 13275
- 13600
Introduction to Technical Analysis
Time Frame Analysis
Recommended by Zain Vawda
FTSE 100: Flip-Flops Between Gains and Losses as UK PMI Declines
The FTSE flip-flopped after a negative opening in London briefly posting gains before declining once more, keeping it on track for its fourth weekly decline in five. As evidenced by another weak opening, volatility and uncertainty unfortunately remain key watchwords. On Thursday, the index suffered its worst month since March 2020, while around $13tn (£10.7tn) was wiped off global stocks in the worst first half of the year on record.
The seasonally adjusted S&P Global UK Manufacturing Purchasing Managers’ Index (PMI) fell to a two-year low of 52.8 in June, down from 54.6 in May. The PMI has remained above the 50.0 mark since June 2020.
The sectoral breakdown is mixed with energy gaining 1.3% while real estate lags with losses of 1.7%.
Introduction to Technical Analysis
Support and Resistance
Recommended by Zain Vawda
FTSE 100 Daily Charts - July 1, 2022
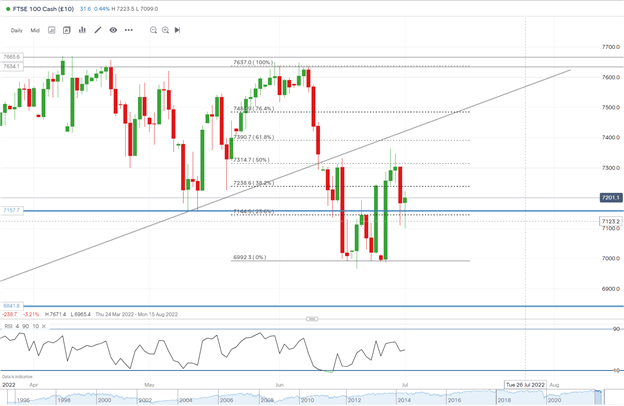
Source:IG
The FTSE pushed down yesterday to around 7100, spiking through the 23,6% fib level before rejecting and the daily candle closing back above. We have seen a push down to retest those lows in European trade before a sharp bounce pushing us higher. As we approach the 38.2% fib level, we may find resistance here. A break above and a bullish close before the weekend could see us push higher next week for the long awaited trendline retest which lines up with the 61.8%-76.4% fib regions.
Key intraday levels that are worth watching:
Support Areas
- 7080
- 6990
- 6870
Resistance Areas
- 7197
- 7284
- 7400
| Change in | Longs | Shorts | OI |
| Daily | 4% | -5% | -3% |
| Weekly | 14% | -2% | 1% |
DOW JONES: Down as Risk Aversion Boosts Havens and Bonds
The Dow opened lower Friday, adding further losses to the weakest first half for US stocks in over 50 years. The Dow ended the quarter with losses of just over 11%, down around 15% for the year-to-date.
Meanwhile, the risk of another sell-off in equity markets remains high, according to Goldman Sachs, as investors are only pricing a mild recession.“Much of the valuation de-rating this year has been due to higher rates/inflation,” Goldman analysts said, in a note. “Unless bond yields start to decline and buffer rising equity risk premiums due to recession fears, equity valuations could decline further.”
The main U.S. data release Friday is the ISM manufacturing PMI for June, with the index expected to drop to 54.9 from 56.1 the previous month.

Customize and filter live economic data via our DailyFX economic calendar
DOW JONES Daily Chart – July 1, 2022
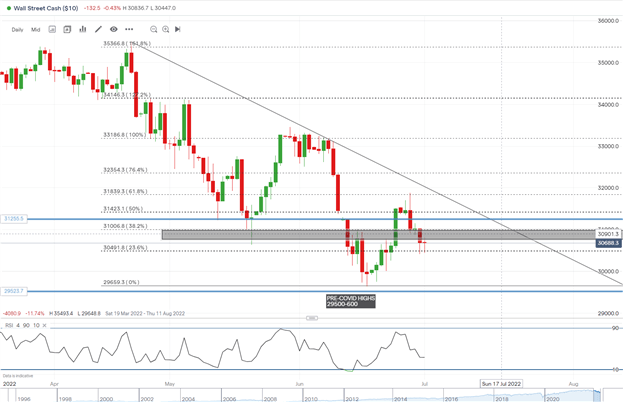
Source: IG
From a technical perspective, we pushed below our key psychological area 31000 (grey box on the chart) and had a daily candle close below. However the downside move was halted as we bounced off the 23.6% fib level. Price remains pressured below the psychological level while a retest of 31000 could offer a solid sell-the-rally opportunity for would-be shorts. Any break back above resistance could see us finally retest the trendline which lines up with the 61.8% fib level.
Key intraday levels that are worth watching:
Support Areas
- 30500
- 30000
- 29500
Resistance Areas
- 31000
- 31420
- 31850
| Change in | Longs | Shorts | OI |
| Daily | -13% | 5% | -3% |
| Weekly | 15% | -4% | 3% |
Written by: Zain Vawda, Market Writer for DailyFX.com
Contact and follow Zain on Twitter: @zvawda


