


GOLD TALKING POINTS
- Gold price key levels.
- Sideways price action coming to an end?
- Learn the basics of gold trading with our comprehensive beginners guide.
XAU/USD TECHNICAL BACKDROP
Gold was buoyed in early trading after a yesterday’s slump with the U.S. dollar going into the European session weaker. Price action has remained largely unchanged since early May this year with the consolidatory move developing within various technical patterns.
TECHNICAL ANALYSIS
GOLD PRICE WEEKLY CHART
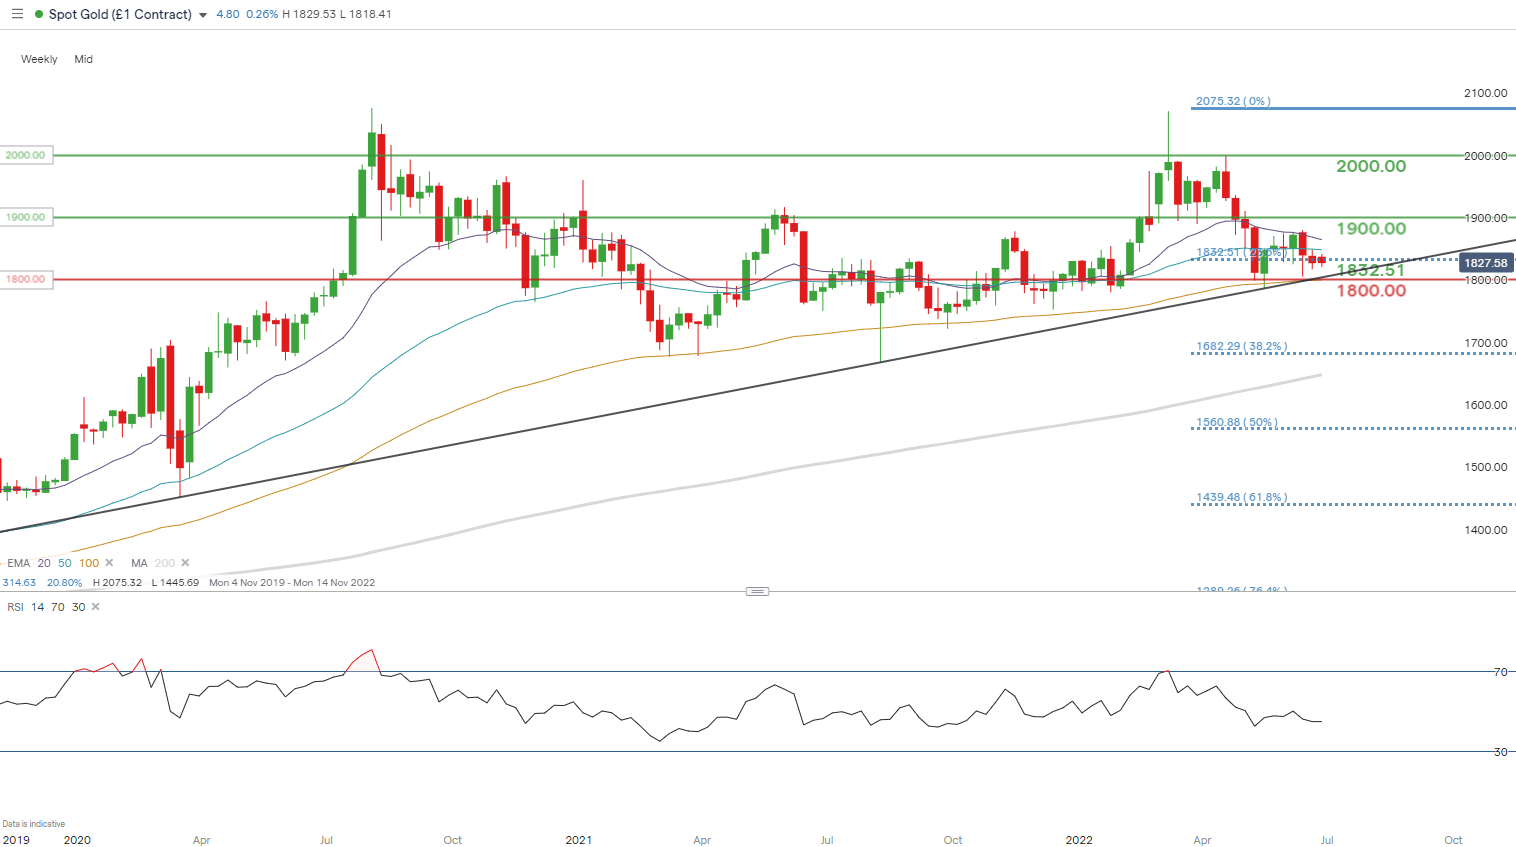
Chart prepared by Warren Venketas, IG
The long-term weekly chart shows this weeks candle approaching a key inflection point around trendline support (black), which has been propping up gold prices since mid-June 2019. A break below could trigger a selloff and will coincide with the break of the 100-day EMA (yellow) as well.
The daily spot gold chart shows prices hovering around the key inflection point at $1800.00 which coincides with the longer term formation. Currently, the breakout from the points to further downside towards subsequent support zones.

GOLD PRICE DAILY CHART
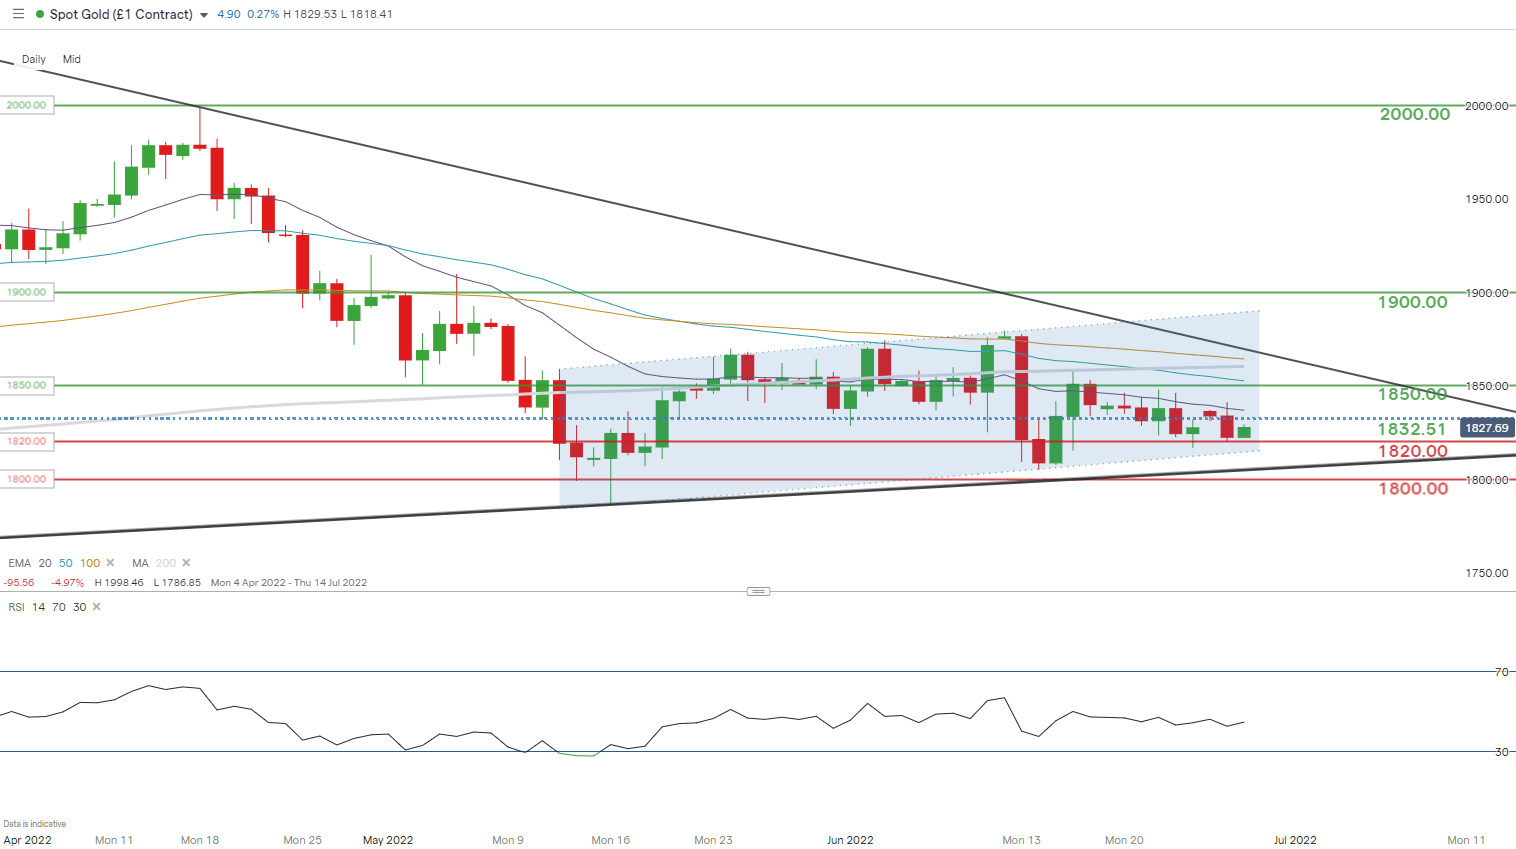
Chart prepared by Warren Venketas, IG
Zooming into the short-term daily chart, we can see that the symmetrical triangle (black) remains in play while prices continue to track within the bear flag (blue) chart pattern. Traditionally, a symmetrical triangle breakout can occur either up or down but with the arrival of the bear flag, our bias does skew towards the downside. The bear flag represents a continuation pattern supportive of the preceding short-term trend (bearish). I will be looking for a confirmation break below flag support but more importantly, trendline support and the psychological $1800 level. This being said, current market indecision is highlighted by the Relative Strength Index (RSI) on both the weekly and daily timeframes reading around the 50 mark which favors neither bullish or bearish momentum. This breakout is likely to occur on the back of a fundamental catalyst in the days/weeks to come but since we are approaching the triangle apex point, I do not see this being too far away.
Resistance levels:
Support levels:
- 1820.00
- 1800.00
IG CLIENT SENTIMENT: BEARISH
IGCS shows retail traders are currently distinctly LONG on gold, with 86% of traders currently holding long positions (as of this writing). At DailyFX we typically take a contrarian view to crowd sentiment resulting in a short-term downside bias.
| Change in | Longs | Shorts | OI |
| Daily | -2% | -6% | -4% |
| Weekly | -1% | -10% | -5% |
Contact and follow Warren on Twitter: @WVenketas


