


Gold Price, Chart, and Analysis
- 10-year US Treasury yields back above 1.60%.
- Gold sitting on a prior resistance level.
Trade Smarter - Sign up for the DailyFX Newsletter
Receive timely and compelling market commentary from the DailyFX team
Keep up to date with all market-moving data releases and events by using the DailyFX Calendar
Gold has given back nearly all of last Wednesday’s post-CPI release rally and is now back at an important chart level that has steered price action over the last few weeks. The precious metal’s main driver remains the US dollar which in turn is being driven by US Treasury yields and future inflation expectations. The yield on the market barometer UST 10-year is now back above 1.60% and is close to printing a fresh multi-week high, helping the greenback push back off last week’s lows. There are a clutch of Fed members speaking tomorrow and their comments need to closely followed for further indications on tapering and price pressure expectations.

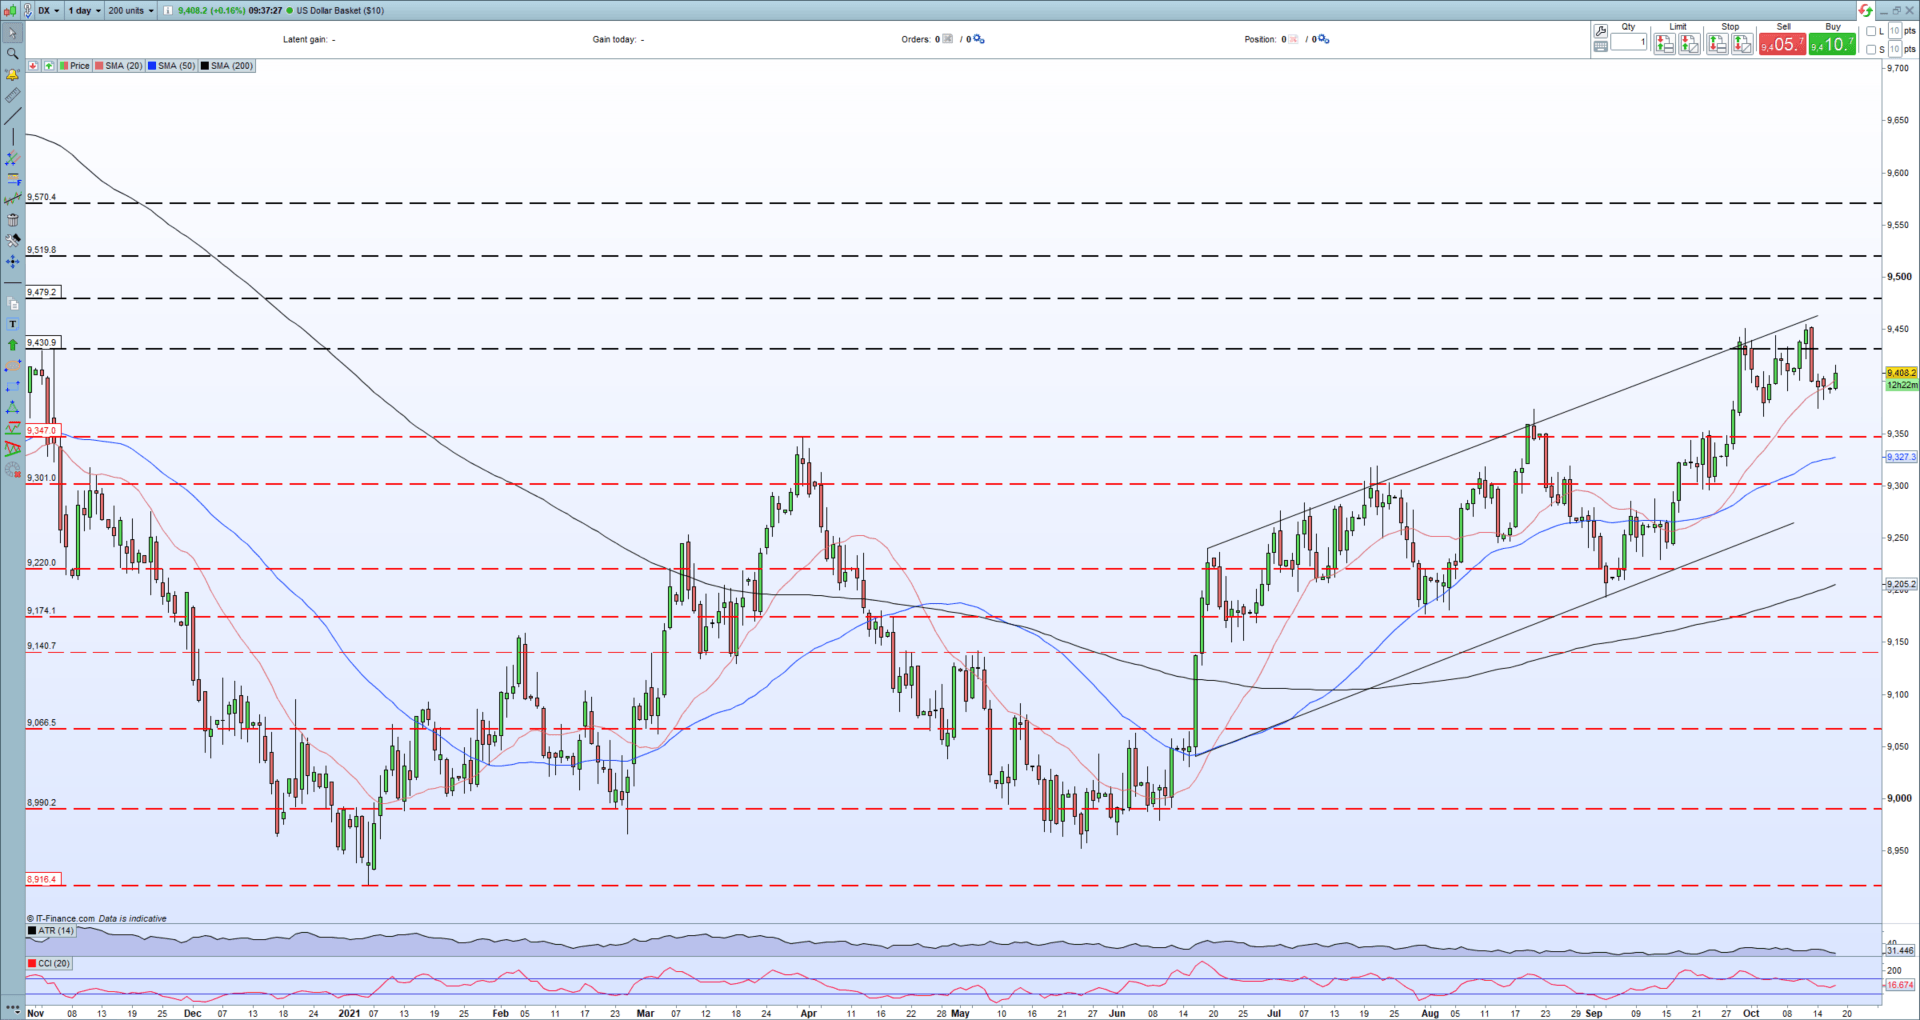
US Dollar Basket (DXY) Daily Price Chart October 18, 2021
The daily gold chart is back trading around the 50% Fibonacci retracement level at $1,764/oz. with little in the way of support until a cluster of recent lows around $1,750/oz. The technical outlook has taken a turn for the worse with gold opening below both the 200- and 50- day simple moving averages, with the 20-dsma is currently under pressure. A break and open below here would bring $1,750/oz. into play ahead of the late-September double low prints around $1,722/oz.
Gold (XAU/USD) Daily Price October 18, 2021

Retail trader data show 80.24% of traders are net-long with the ratio of traders long to short at 4.06 to 1. The number of traders net-long is 2.58% higher than yesterday and 2.98% higher from last week, while the number of traders net-short is 3.20% higher than yesterday and 12.01% lower from last week.
We typically take a contrarian view to crowd sentiment, and the fact traders are net-long suggests Gold prices may continue to fall. Positioning is less net-long than yesterday but more net-long from last week. The combination of current sentiment and recent changes gives us a further mixed Gold trading bias.

What is your view on Gold – bullish or bearish?? You can let us know via the form at the end of this piece or you can contact the author via Twitter @nickcawley1.


