


Key Talking Points:
- Ethereum rises to new all-time high
- Bitcoin continues to face rejection in the area surrounding the 60,000 mark
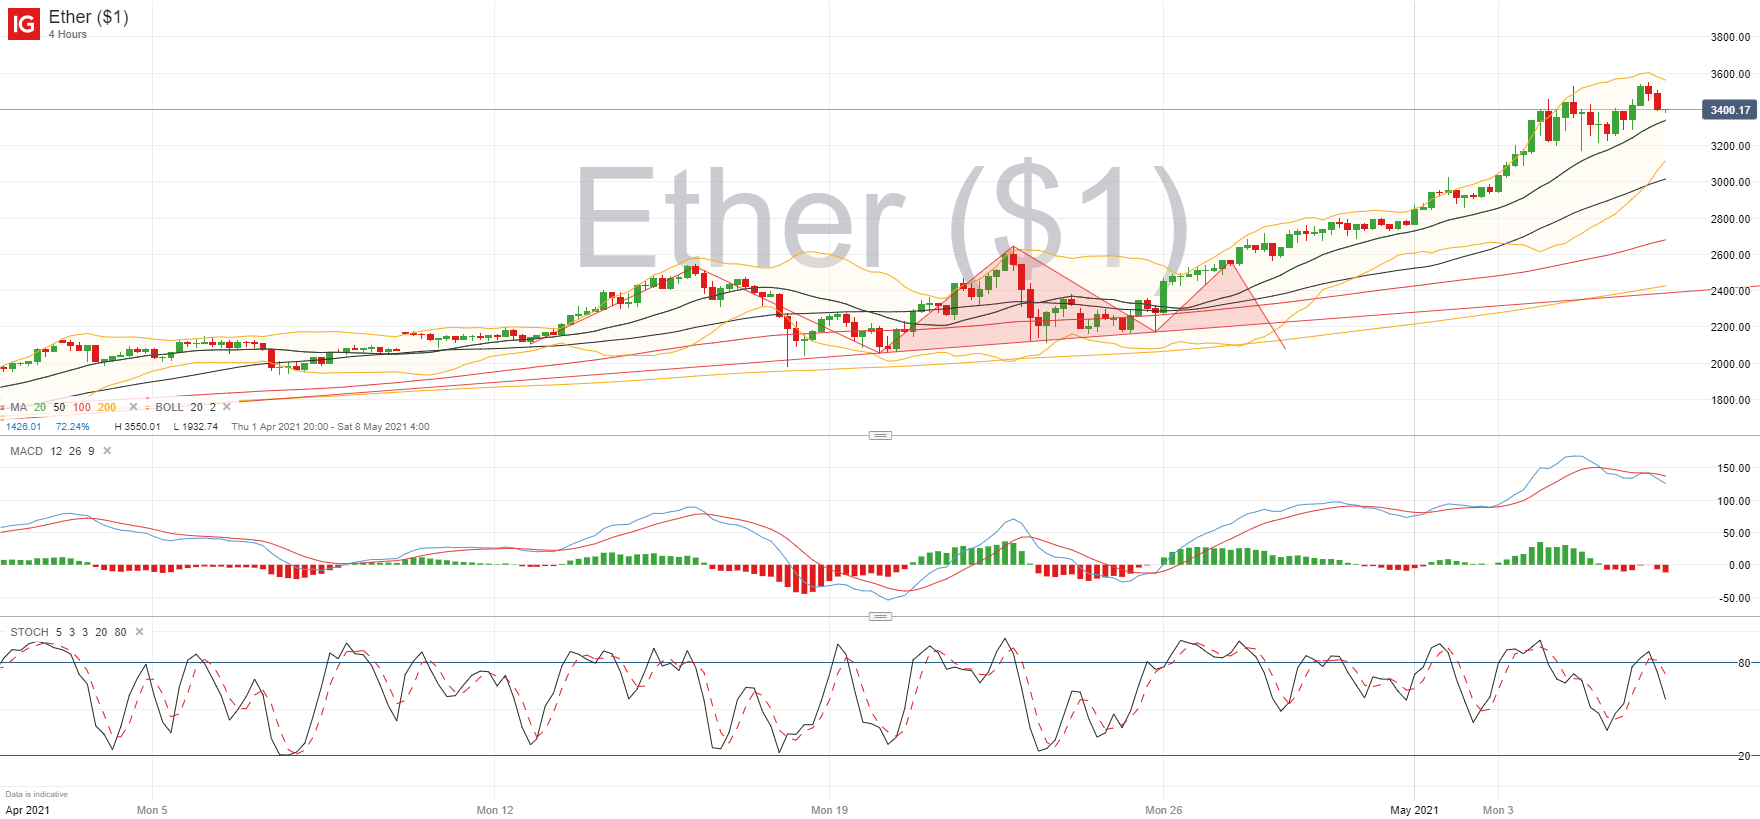
Ethereum rose by 6.5% on Wednesday, reversing the losses from the day prior, and consolidating its recent rally. But buyers are struggling again this morning to keep bullish momentum going, with a fresh rejection just off the previous resistance at 3,528. Having fallen below the 3,500 is putting buyers at further risk of reversal, although the mid-point of its Bollinger Bands seems to have been helping stem the losses in recent sessions as can be seen on the 4-hour chart. Therefore, 3,325 may act as immediate support, before the 3,210 area comes into play.
The width of the Bollinger bands continues to be spread out so we’re likely to see further volatility, although the range is starting to tighten so we may see price action slow down in the next few sessions. Both the MACD and stochastic oscillator are signaling further weakness to come, but I expect the 3,600 mark to be a short-term objective for buyers.
Ethereum 4-hour Chart
How to Read a Candlestick Chart
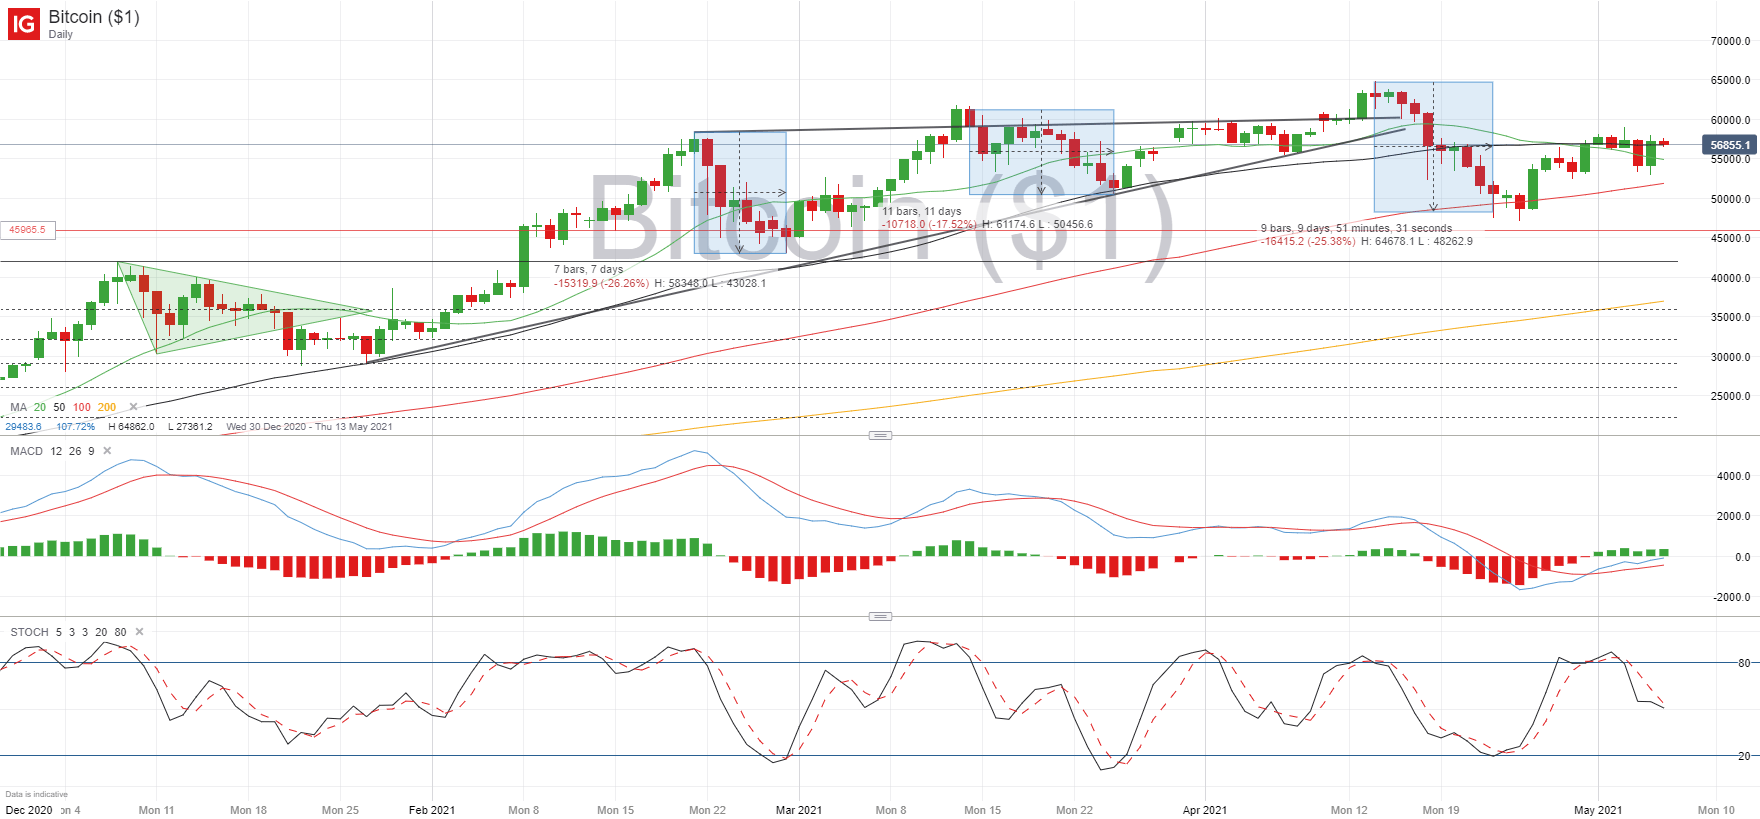
Meanwhile, Bitcoin has managed to regain its bullish bias, having bounced back over 20% in the last 10 days after hitting a two-month low on April 25th. That said, the 60,000 continues to offer strong resistance as BTC/USD is once again struggling to get within range of it. It has been rejected around the 58,100 area for the past 6 days, with the last few sessions seeing lower highs, which could be a possible sign of exhaustion.
For now, if Bitcoin holds above 55,900 we may see a new attempt at the 60,000 line, with greater focus on the all-time high at 65,000. But if buyers are unable to hold and price falls below the 55,000 area then it is possible that BTC/USD retreats back below the 50,000 mark.
BTC/USD Daily chart

Learn more about the stock market basics here or download our free trading guides.
--- Written by Daniela Sabin Hathorn, Market Analyst
Follow Daniela on Twitter @HathornSabin


