

GOLD FORECAST: PRECIOUS METALS STILL PRESSURED BY RISING REAL YIELDS, US DOLLAR STRENGTH
- Gold price action extends lower to start the week as real yields and the US Dollar rise further
- Precious metals have faced serious headwinds and risk dropping into bear market territory
- Gold outlook could turn even more downtrodden with a breakdown of its bull flag pattern
- Sharpen your technical analysis skills or learn about implied volatility trading strategies!
Precious metals continue to lose their luster as gold and silver prices extend their selloff. Gold price action just dropped another -1.2% during Monday trade to print a fresh nine-month low and leaves it the most oversold since August 2018. The price of gold now hovers on the brink of bear market territory near $1,680/oz. This latest stretch lower could see gold selling pressure accelerate due to the latest breakdown of technical support around $1,690/oz.
GOLD PRICE CHART WITH US DOLLAR INDEX OVERLAID: WEEKLY TIME FRAME (DEC 2019 TO MAR 2021)
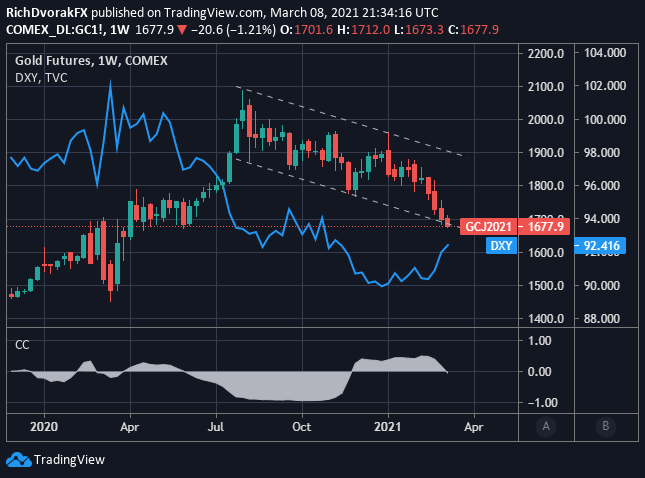
Chart by @RichDvorakFX created using TradingView
One primary driver of gold price weakness has been surging real yields. More recently, the rise in real yields has also corresponded with a stronger US Dollar. This poses a major headwind for gold bulls considering the precious metal typically maintains an inverse relationship with the US Dollar.
| Change in | Longs | Shorts | OI |
| Daily | -11% | 4% | -5% |
| Weekly | -8% | -2% | -5% |
Gold price action appears to be at a critical juncture with its broader bull flag chart pattern now in jeopardy following the latest stretch lower. Failure to catch a bid off this key technical barrier might open the door to a deeper pullback toward long-term trendline support extended through the April 2019 and March 2020 swing lows. If a rebound attempt comes into play, however, gold bears might look to fade the 20-day simple moving average.
-- Written by Rich Dvorak, Analyst for DailyFX.com
Connect with @RichDvorakFX on Twitter for real-time market insight