


Key Talking Points:
- DAX 30 clears resistance and heads for all-time high
- FTSE 100 struggles to break free from 61.8% Fibonacci
DAX 30 TECHNICAL OUTLOOK
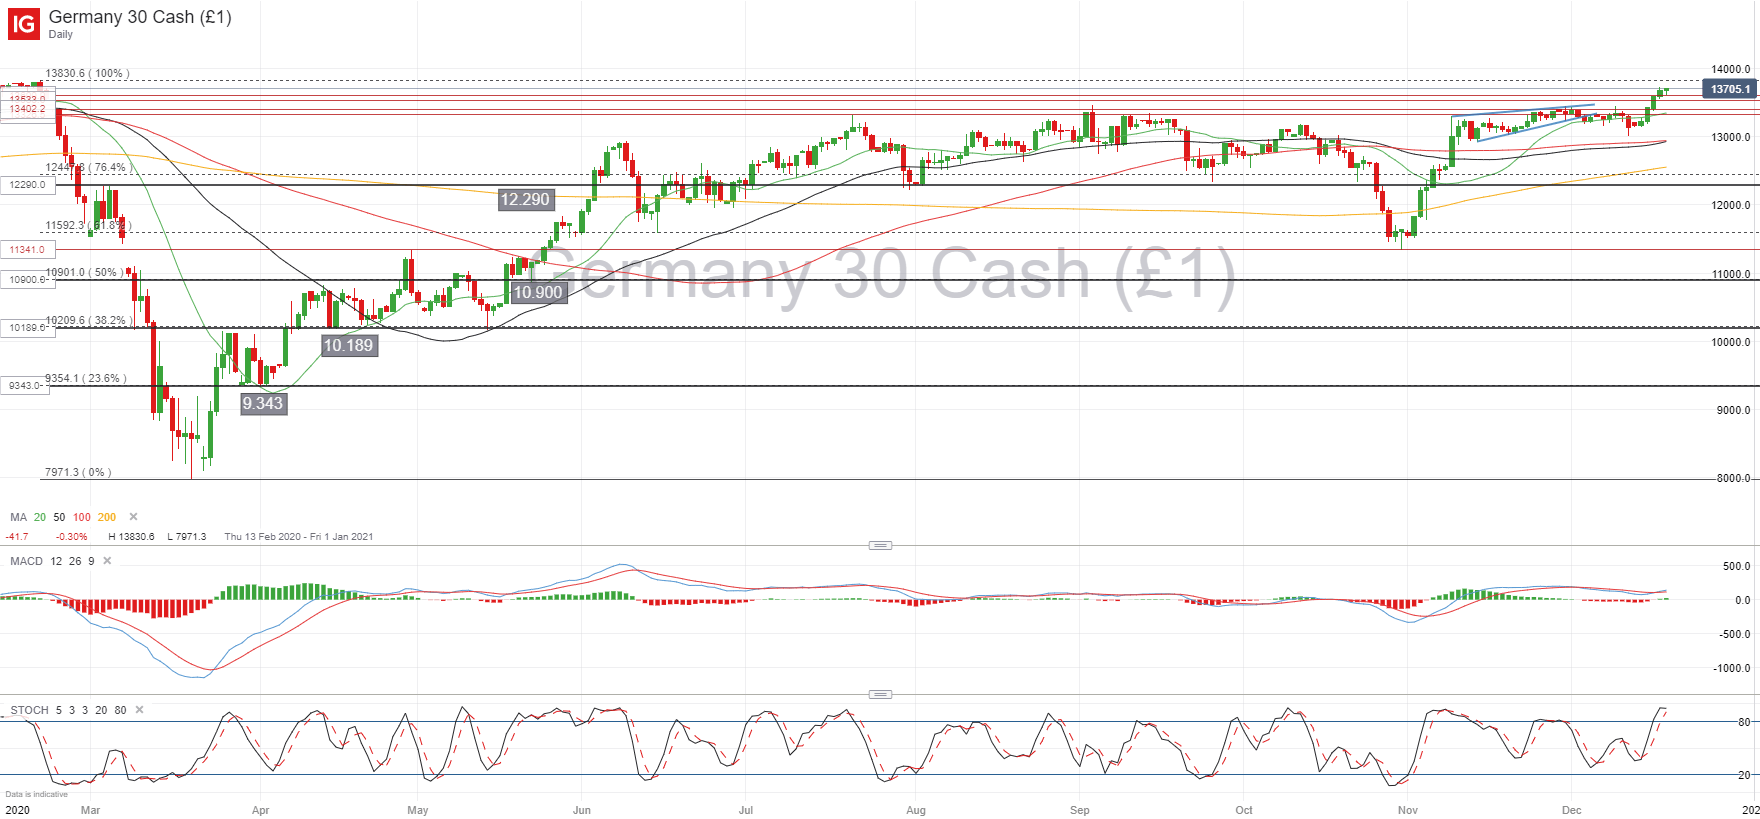
The DAX has managed to break various horizontal resistance lines in its 3.8% rise since Tuesday, leaving the German stock index just shy of its all-time high seen last March at 13,830. The issue I’m having with getting fully behind the DAX is this notion of borrowed future returns, and what this will mean for the index in the new year. Momentum indicators are signaling strong overbought conditions, and quite frankly, the DAX has been tagging along with US stock indices ignoring domestic turbulence regarding the Covid-19 pandemic.
This has set up a scenario where a possible fiscal stimulus package in the US would continue this Santa rally until the end of the year, most likely taking the DAX above its all-time high, but significant risks remain and shouldn’t be ignored, which is why I find it hard to imagine that we’ll see a break above the 14,000 level in the short-run.
Failure to break above 13,830 could see the DAX heading lower at the start of the new year, but for now the 13,000 level remains as a strong area of support. It will take more than just a failure of stimulus talks to turn sentiment bearish given how risk-on they currently are, but a break below 12,915, where the 50-day and 100-day moving averages converge, is likely to see increase selling pressure back towards the 12,290 level.
Stock Market Holiday Calendar 2020/21

DAX 30 Daily chart
| Change in | Longs | Shorts | OI |
| Daily | -22% | -1% | -7% |
| Weekly | 13% | -11% | -5% |
FTSE 100 TECHNICAL OUTLOOK
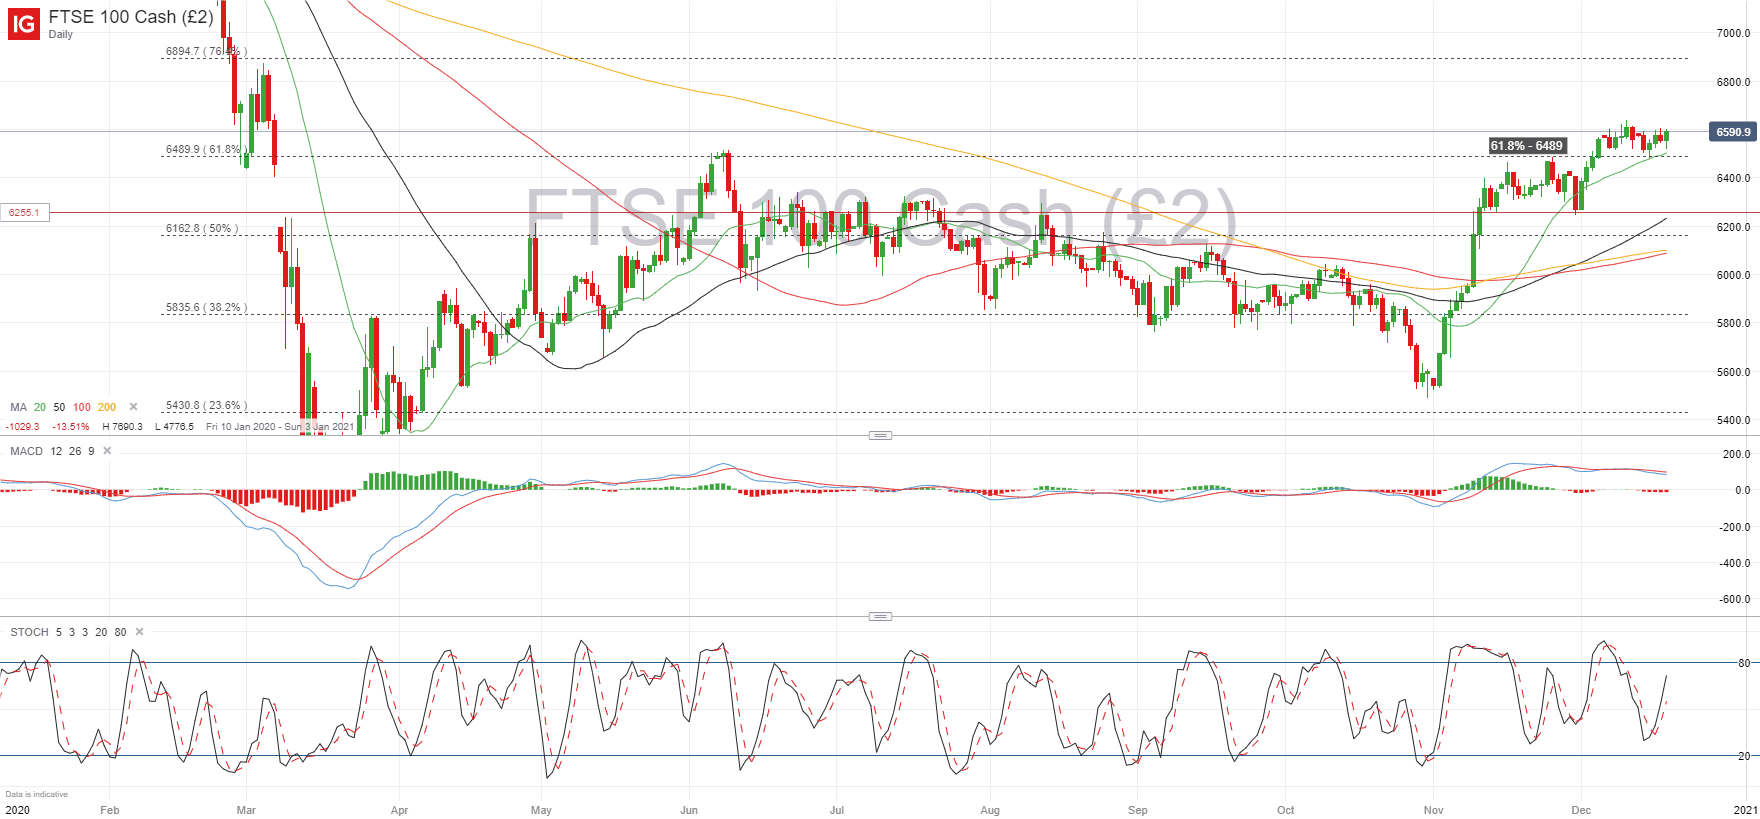
The FTSE 100 has struggled to break free from the 61.8% Fibonacci retracement level after pushing above 6,490 at the beginning of the month. The recent strength in the Pound is likely one of the driving forces behind this underlying weakness in the FTSE, as is the worsening health situation in the country. Technically, the stock index is still showing weakness in its push higher but the path of least resistance seems to remain tilted to the upside, so further extension of the rebound since the beginning of November may be expected.
Momentum indicators more on the bullish side, as the Stochastic nears the 70 level, where overbought pressure is starting to build. The 20-day moving average is likely to offer short-term support at 6,490, followed by the horizontal support line at 6,255. A retracement back to this level risks exposing the FTSE to the coronavirus gap, and the 61.8% Fibonacci would likely be a strong resistance again.
Pushing higher, the first obstacle will be overcoming the ceiling the index has been trapped under in recent days, located around the 6,635 area. Further selling pressure could arise around the 6,660 level followed by the 76.4% Fibonacci at 6,895.
FTSE 100Daily chart
| Change in | Longs | Shorts | OI |
| Daily | -9% | 0% | -1% |
| Weekly | -29% | 4% | -2% |
Learn more about the stock market basics here or download our free trading guides.
--- Written by Daniela Sabin Hathorn, Market Analyst
Follow Daniela on Twitter @HathornSabin


