


Dow Jones, ASX 200, Hang Seng US Fiscal Stimulus – Asia Pacific Indices Briefing
- Dow Jones plunged alongside pre-election fiscal stimulus hopes
- Hang Seng Index may follow the pessimistic lead on Wall Street
- ASX 200 could rejoice as RBA reiterates recent dovish rhetoric
Equities on Wall Street traded in the red on Monday, opening the door to setting a pessimistic tone in markets over the next 24 hours. The Dow Jones sank 1.44% in its worst day in almost one month. The tech-heavy Nasdaq 100 declined 1.65% and the S&P 500 dropped 1.63%. Weakness in equities could be traced to a decline in fiscal stimulus hopes from the world’s largest economy.
Speaker of the House Nancy Pelosi held talks with Treasury Secretary Steven Mnuchin, noting that they “continued to narrow their differences” over a relief package. The former set a deadline to reach an agreement with the White House by Tuesday. This is as President Donald Trump has said he is willing to match the $2.2 trillion bill that the Democrats have been leaning on.
Differences remain in the Republican-led upper chamber of Congress. Senate Majority Leader Mitch McConnell has opened the door to a targeted stimulus deal of around $500 billion. A vote on it is expected this week. However, the majority leader has continued to oppose going beyond the Republican-proposed $1.8 trillion package. Without the Senate’s support, the overall package may not pass before the election.
Dow Jones Technical Analysis
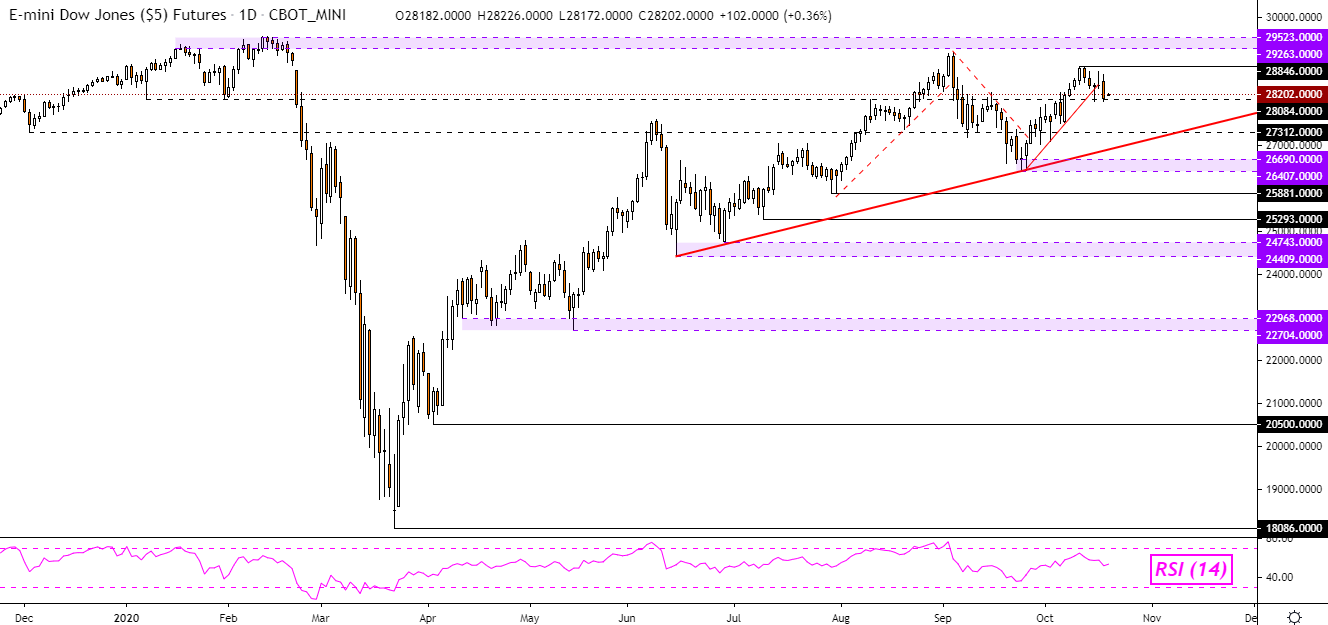
Dow Jones futures could be at risk of turning lower. The index closed under a short-term rising trendline from the middle of September. However, confirmation is lacking. A further drop through the 28084 inflection zone could be that bearish signal. Otherwise, key immediate resistance to watch seems to be at 28846.

Dow Jones Futures – Daily Chart
Tuesday's Asia Pacific Trading Session – ASX 200, Hang Seng, RBA
Asia Pacific equities could be looking at a pessimistic day ahead. The Hang Seng, Hong Kong’s benchmark stock index, could this revers gains from yesterday. Yet, traders ought to be mindful of breaking headlines around US fiscal stimulus talks that could shift in the short term, opening the door to volatility. S&P 500 futures are pointing higher which could dampen some of the anticipated losses in APAC stocks.
The ASX 200, Australia’s benchmark stock index, may even receive a boost following dovish commentary from the Reserve Bank of Australia (RBA). Assistant Governor Christopher Kent noted that “there is still room to compress short-term rates”. Minutes of the RBA’s October interest rate announcement showed that officials were assessing the effects of lower borrowing costs on confidence and savers.

ASX 200 Technical Analysis
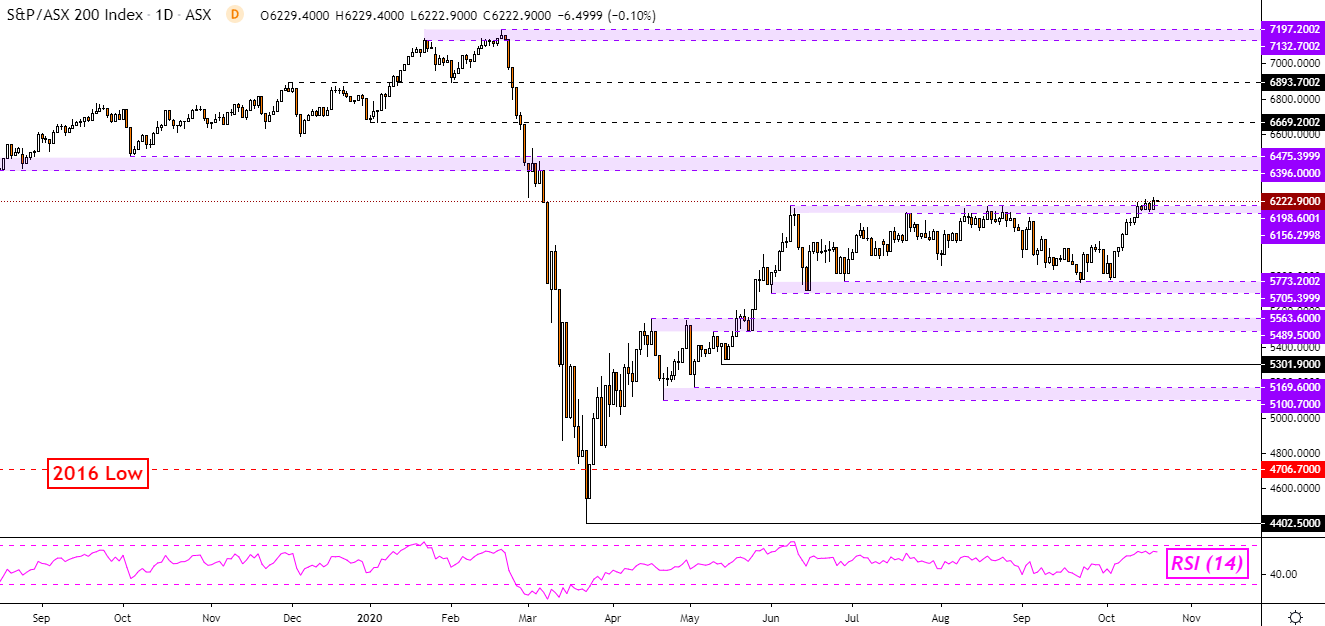
The ASX 200 is attempting to confirm a break above the 6198 – 6156 resistance zone. That would open the door to ending its consolidation since late May between support (5705 – 5773) and resistance. This subsequently exposes the former 6396 – 6475 support zone which could stand in the way as new resistance.
ASX 200 – Daily Chart
Hang Seng Technical Analysis
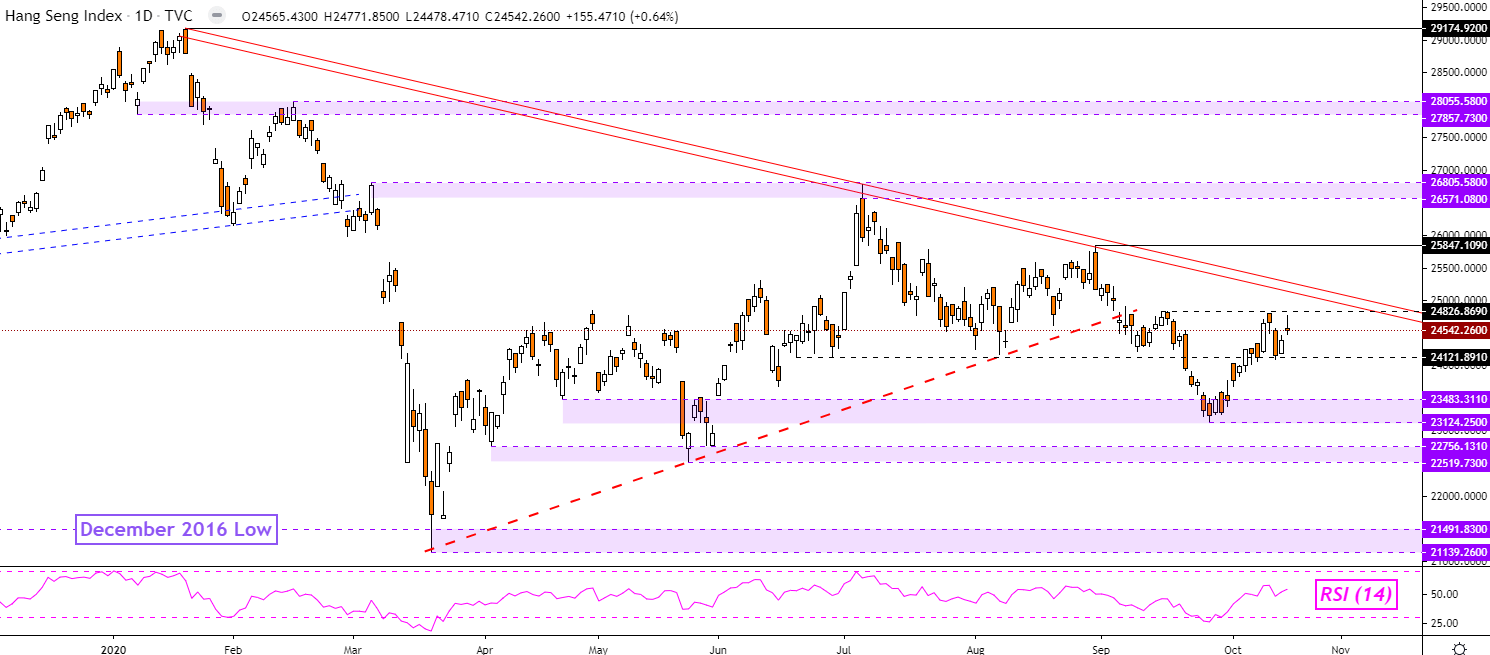
The Hang Seng may fall after prices were unable to breach resistance at 24826. A turn lower from here places the focus on the 24121 inflection point towards upper support at 23483. Maintaining the overall downtrend appears to be falling resistance from early 2020. Pushing above this zone exposes the August high at 25847.
Hang Seng – Daily Chart
--- Written by Daniel Dubrovsky, Currency Analyst for DailyFX.com
To contact Daniel, use the comments section below or @ddubrovskyFX on Twitter


