


US Dollar (DXY) Price, Chart and Analysis.
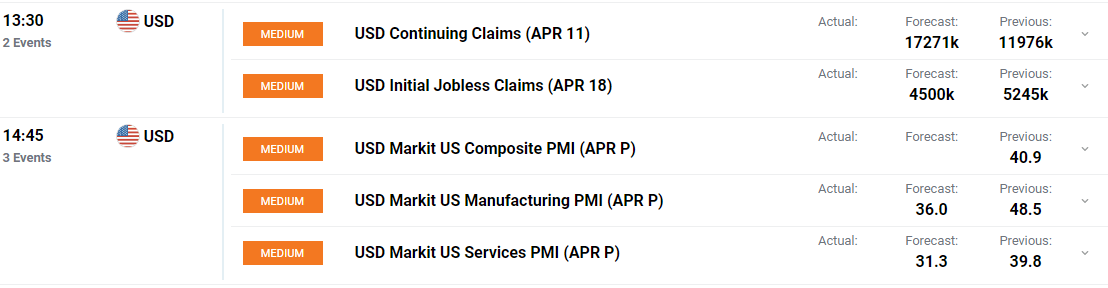
- Initial jobs claims and preliminary PMI data on the slate.
- US dollar remains the shelter in a storm.

US Dollar (DXY) Price – Higher Lows But Important Data Prints Near.
The greenback has moved steadily higher all week, touching levels last seen two weeks ago. Today’s move was given a push by Euro-Zone and UK PMI data releases which recorded record lows, with the services sector in particular hammered by the sharp economic downturn caused by coronavirus.
EUR/USD Drops as Eurozone PMI Crash Signals Severe Recession
The US dollar now faces its moment of truth with both the weekly initial jobless claims data and the preliminary April PMIs release out this afternoon. The services PMI should be closely followed after both the EU and UK readings cratered to record lows of 11.7 (26.4 prior) and 12.3 (36.0 prior) respectively. The initial jobless claims figure is forecast at 4.5 million for the week ending April 18. In the last four weeks, the jobless queue in the US has grown by over 22 million, wiping out all of the last decades job creation.
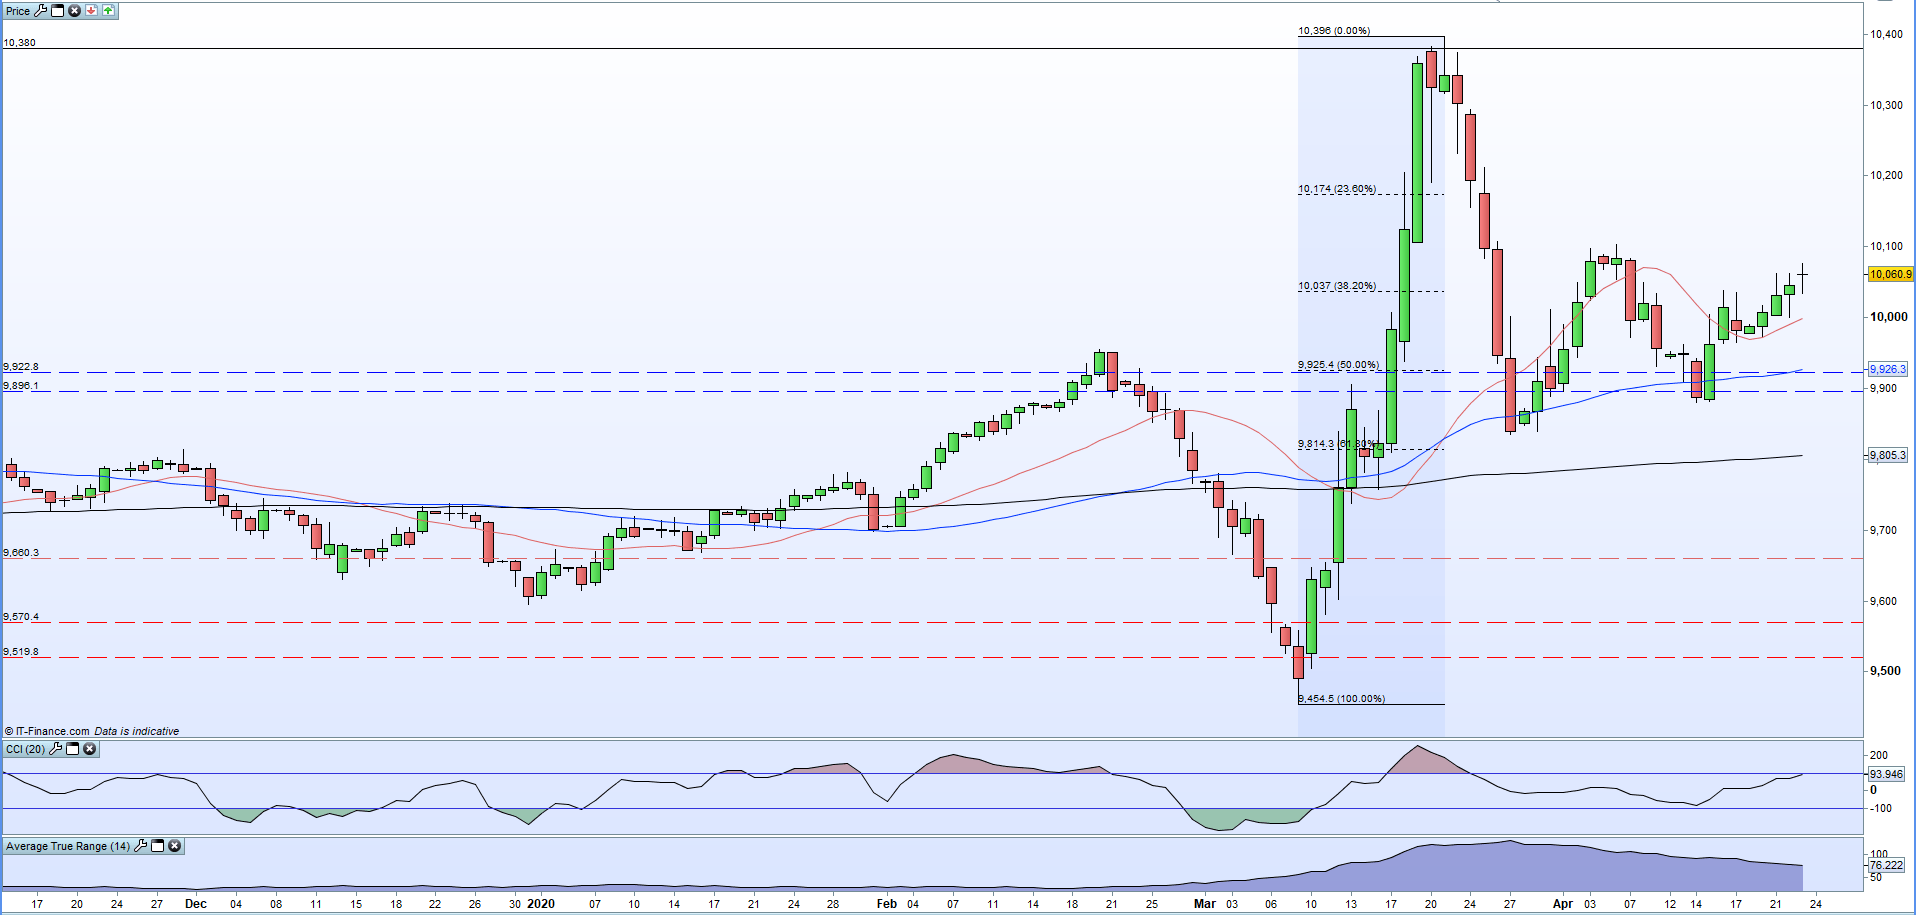
The daily US dollar basket (DXY) chart continues to flash positive technical signals with a series of higher lows and a pair of higher swing-lows showing on the chart. The 20-day moving average is adding weight to support, while a close above the 38.2% Fibonacci retracement level at 100.37 would likely open a re-test of the April 6 high at 101.04. Above here, the DXY would likely eye 101.74 in the short- to medium-term. Support seen at 99.62 before cluster of prior lows and the 50% Fibonacci retracement (99.25) and the double low at 98.80.
US Dollar (DXY) Daily Price Chart (December 2019 - April 23, 2020)

Traders may be interested in two of our trading guides – Traits of Successful Traders and Top Trading Lessons – while technical analysts are likely to be interested in our latest Elliott Wave Guide.
What is your view on the US Dollar – bullish or bearish?? You can let us know via the form at the end of this piece or via Twitter @nickcawley1.


