


Gold (XAU) Price, Charts and Analysis
- Fundamentals remain cloudy and of little help.
- Short-term triangle formation normally suggests a break-out.
Q4 2019 Gold Forecast and Top Trading Opportunities
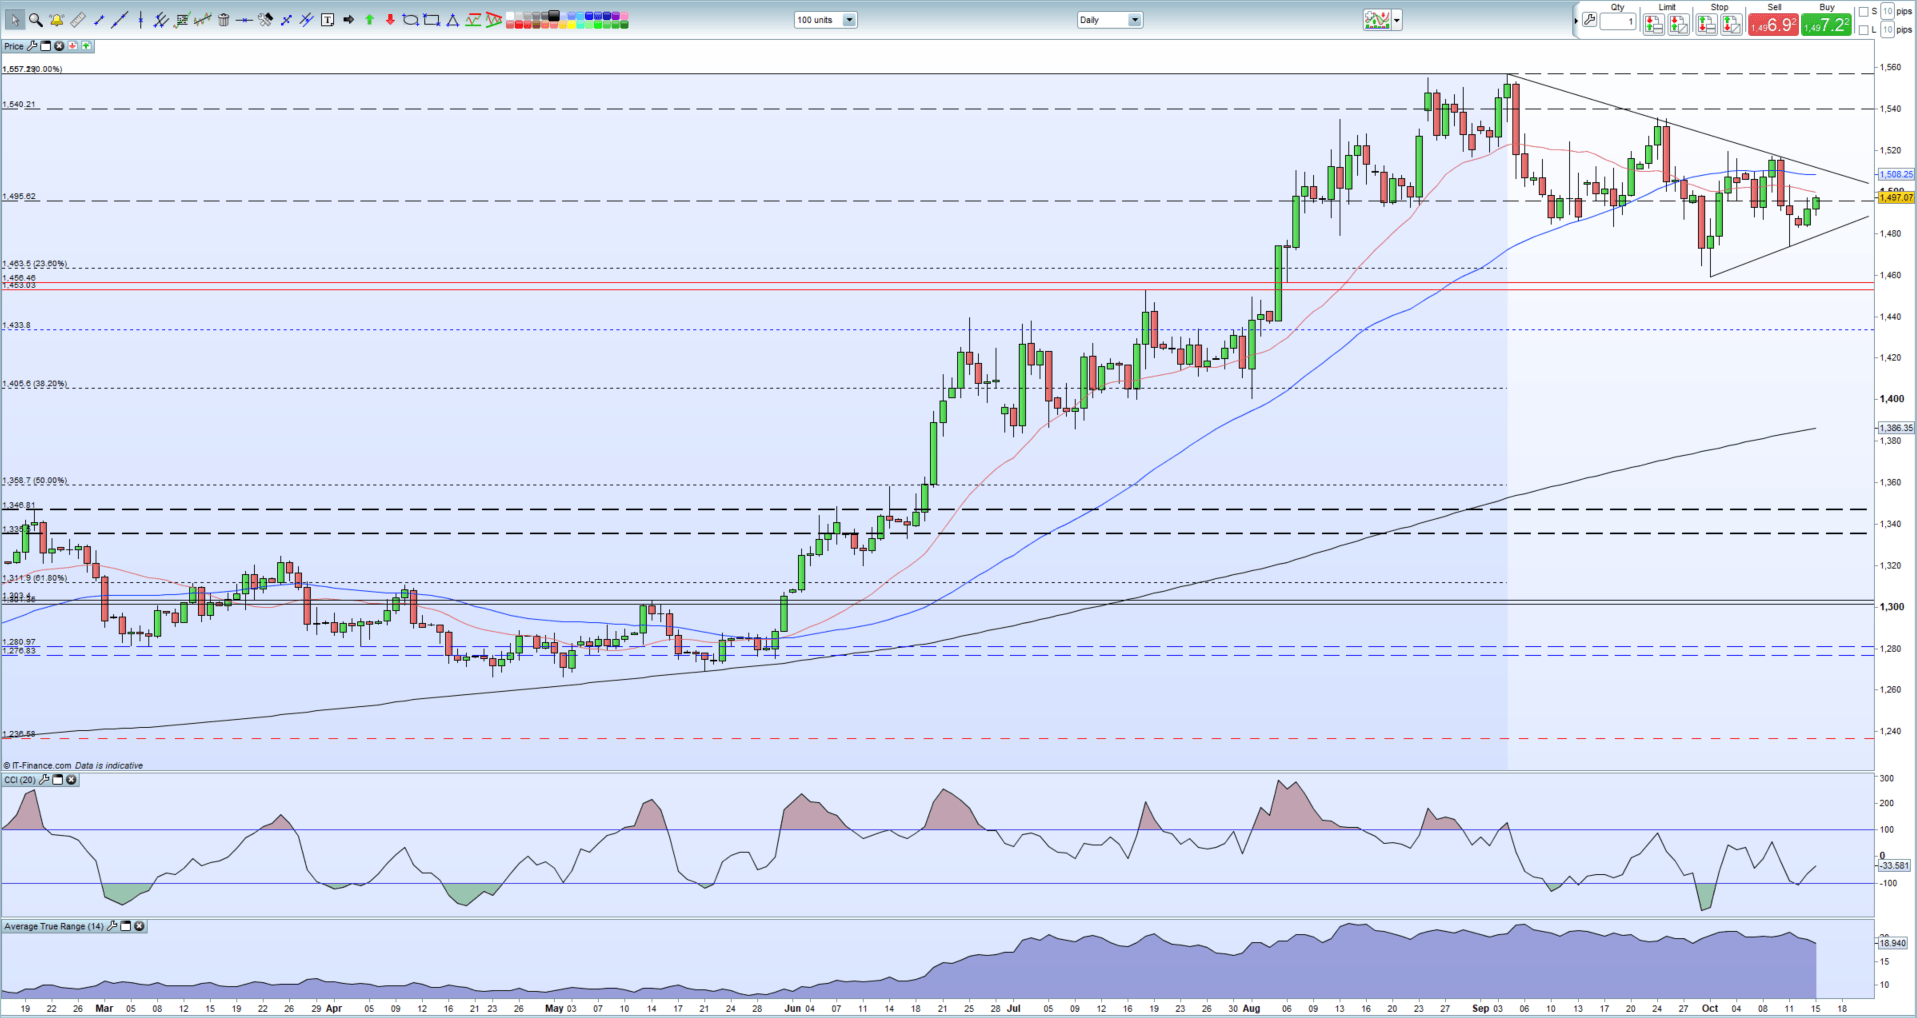
Gold is coiling and readying itself for a breakout with the upside favored at the moment. The short-term triangle formation currently being made normally precedes a break higher when the apex of the support and resistance trendlines nears. This trendline convergence should be closely monitored.
Fundamental drivers for gold remain mixed with the US dollar currently treading water after breaking below is recent uptrend, while risk sentiment swings from positive to negative depending on the market’s take on the ongoing US-China trade war at any point in time. Turkey’s incursion into Syria, and the imposition of penalties by the US on Turkey, have the potential to turn the dial towards risk-off - boosting gold – so the fundamental outlook may favor the support trendline being held.
Using the Average True Range indicator, the market trading range ($18.75) is currently at its narrowest level (just) since August 5 when the market jumped higher off a $1,438/oz. low print. The CCI indicator shows that the market is neither overbought or oversold. As the formation continues, the ATR should fall further with a break-out becoming increasingly likely.
Initial resistance will come off the 20-day and 50-day moving averages - $1,500/oz. and $1,508/oz respectively –before the downtrend at $1,512/oz. Above here there a cluster of old highs may slow any move back to the double top around $1,536/oz. made in late September. Support from trendline at $1,479/oz followed by $1,474/oz. ahead of 23.6% Fibonacci retracement at $1,463.5/oz.
Gold Price Daily Chart (February – October 15, 2019)
IG Client Sentiment data show that 69.0% of retail traders are net-long of gold, a bearish contrarian indicator. However, daily and weekly sentiment shifts give us a mixed outlook for gold.
How to Trade Gold: Top Gold Trading Strategies and Tips
Traders may be interested in two of our trading guides – Traits of Successful Traders and Top Trading Lessons – while technical analysts are likely to be interested in our latest Elliott Wave Guide.
What is your view on Gold – bullish or bearish?? You can let us know via the form at the end of this piece or you can contact the author at nicholas.cawley@ig.com or via Twitter @nickcawley1.


