FTSE 100 Price, Analysis and Chart:
- Sterling (GBP) remains elevated as Brexit talks continue.
- Important FTSE 100 technical resistance needs to be cleared.
The recent push higher in the FTSE has come to a halt despite the markets adopting a risk-on sentiment. Financial markets are continuing to price-in looser monetary policy, adding market liquidity and positive sentiment to an already buoyant equity space. Reports that US – China trade negotiations are moving forward is helping to boost sentiment today, although nothing has been confirmed.
The recent FTSE 100 rally has stalled however, weighed down by a strong British Pound, with the inverse correlation between the two different asset classes holding firm. Sterling is attracting buyers who continue to believe that a No Deal Brexit is being slowly taken off the table and that a solution to the Irish backstop problem will be found before the end of March.
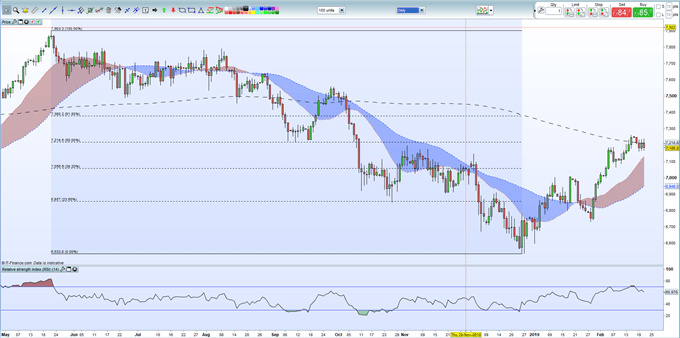
Afterrallying over 700 points from late-December, the FTSE 100 is now finding further upside blocked by two important technical levels. The 50% Fibonacci retracement level and the closely followed 200-day moving average meet around the 7,210 - 7,218 level and while the index has pierced through this area, the FTSE 100 is finding it difficult to break and close decisively above here. In addition, the RSI indicator is just starting to move out of overbought territory, signaling a potential downturn in sentiment. Support is currently pegged around 7,130 and 7,056.
Join DailyFX analyst Justin McQueen every Friday at 11:00 GMT as he takes an in-depth look at Global Equity Indices including the FTSE 100 – You can register here.
IG Client Sentiment data shows how retail are positioned in a wide range of assets and how daily and weekly positional changes shift market sentiment.
FTSE 100 Daily Price Chart (May 2018 – February 21, 2019)

Traders may be interested in two of our trading guides – Traits of Successful Traders and Top Trading Lessons – while technical analysts are likely to be interested in our latest Elliott Wave Guide.
What is your view on the FTSE – bullish or bearish?? You can let us know via the form at the end of this piece or you can contact the author at nicholas.cawley@ig.com or via Twitter @nickcawley1.


