


Gold Price Talking Points
The price of gold pulls back from a fresh weekly high ($1787) even as the Federal Reserve retains the current course for monetary policy as the central bank lays out a tentative exit strategy.
Gold Price Rebound Fizzles as Fed Reveals Tentative Timeline to Taper QE
The price of gold retains the series of higher highs and lows from earlier this week as the Federal Open Market Committee (FOMC) stays on track to “increase its holdings of Treasury securities by at least $80 billion per month and of agency mortgage‑backed securities by at least $40 billion per month,” and bullion may stage a lager recovery over the remainder of the month as the decision by Chairman Jerome Powell and Co. drags on US Treasury yields.
Nevertheless, it seems as though the FOMC is preparing to switch gears later this year as “the Committee judges that a moderation in the pace of asset purchases may soon be warranted,” and Fed officials may lay out a more detailed strategy before the end of the year as Chairman Powell reveals that the central bank could start tapering its quantitative easing (QE) program ‘as soon as the next meeting.’
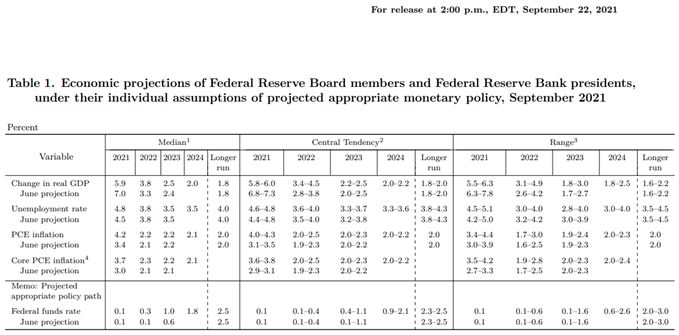
Source: FOMC
During the press conference, Chairman Powell went onto say that it “could be appropriate” to winddown the non-standard measure by mid-2022 as the update to the Summary of Economic Projections (SEP) shows the US economy growing 3.8% next year compared to the 3.3% forecast presented in June, and speculation for a looming shift in Fed policy may keep a lid on the price of gold amid the failed attempt to clear the July high ($1834).
With that said, the price of gold may attempt to stage a larger rebound over the remainder of the month as it manages to retain the series of higher highs and lows from earlier this week, but the rebound from the August low ($1682) may turn out to be a correction in the broader trend rather than a change in market behavior as the FOMC prepares to switch gears.
Gold Price Daily Chart
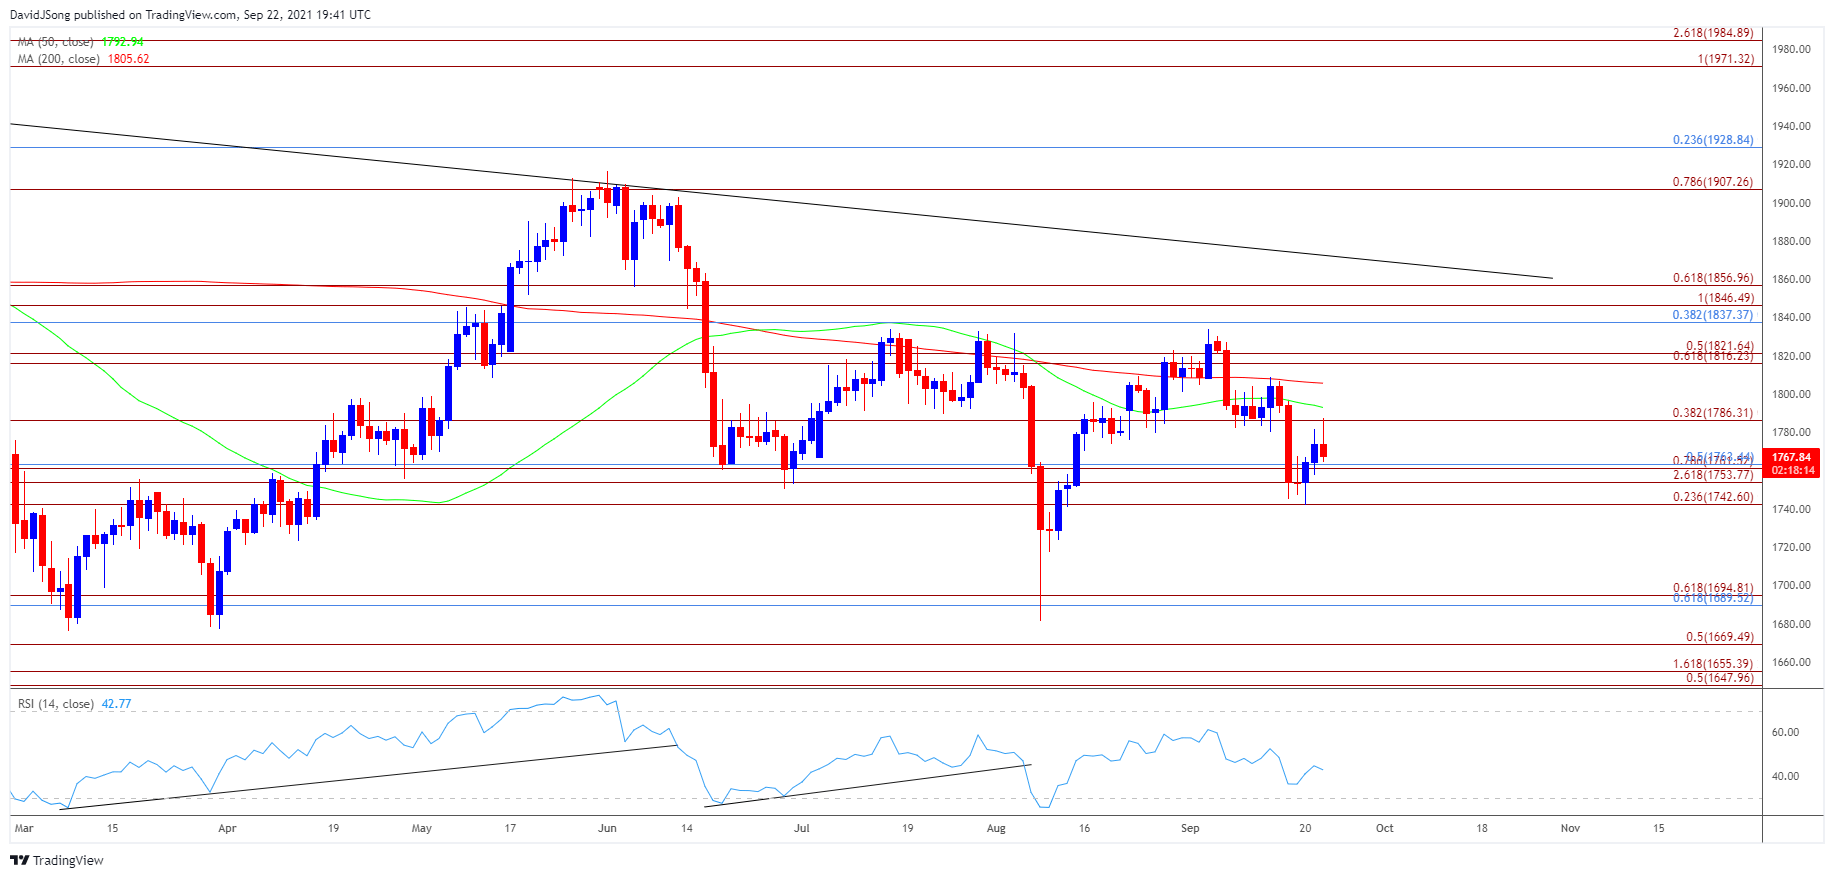
Source: Trading View
- Keep in mind, the negative slope in the 200-Day SMA ($1806) indicates that the broader trend for bullion remains tilted to the downside, with a ‘death cross’ formation taking shape in August as the Relative Strength Index (RSI) pushed into oversold territory.
- However, lack of momentum to test the March low ($1677) generated a textbook buy signal in the RSI as the oscillator climbed back above 30, with the move above the $1786 (38.2% expansion) region pushing the price of gold above the 200-Day SMA ($1806).
- Nevertheless, the rebound from the August low ($1682) may turn out to be a correction in the broader trend rather than a change in market behavior amid the failed attempt to clear the July high ($1834), and lack of momentum to close above the $1786 (38.2% expansion) region may push the price of gold back towards the Fibonacci overlap around $1743 (23.6% expansion) to $1763 (50% retracement).
- A break of the monthly low ($1743) opens up the $1690 (61.8% retracement) to $1695 (61.8% expansion) region, with a move below the August low ($1682) bring the March low ($1677) on the radar.
- Need a close above the $1786 (38.2% expansion) region to open up the $1816 (61.8% expansion) to $1822 (50% expansion) zone, with the next area of interest coming in around $1837 (38.2% retracement) to $1847 (100% expansin).

--- Written by David Song, Currency Strategist
Follow me on Twitter at @DavidJSong


