


Oil Price Talking Points
The price of oil trades to a fresh yearly high ($65.77) as the Organization of the Petroleum Exporting Countries (OPEC) and its allies continue to regulate production, and recent developments in the Relative Strength Index (RSI) indicate that the bullish momentum could gather pace as the oscillator pushes back above 70.
Oil Price Forecast: Crude Eyes 2019 High Following OPEC JMMC Meeting
The price of oil approaches the 2019 high ($66.60) following the OPEC Joint Ministerial Monitoring Committee (JMMC) meeting as Saudi Arabia stays on track to reduce supply by 1 million b/d until April, and current market conditions may keep crude prices afloat as US output remains at its lowest level since 2018.
It seems as though OPEC and its allies are in no rush to switch gears as the group emphasizes “the ongoing positive contributions of the Declaration of Cooperation (DoC) in supporting a rebalancing of the global oil market,” and it remains to be seen if OPEC+ will change its tone over the coming months as group plans “a continuation of the production levels of March for the month of April, with the exception of Russia and Kazakhstan, which will be allowed to increase production by 130 and 20 thousand barrels per day respectively.”
As a result, the price of oil may continue to exhibit a bullish behavior ahead of the next JMMC meeting starting on March 31 as OPEC and its allies pledge to “remain vigilant and flexible given the uncertain market conditions.” At the same time, fresh data prints coming out of the US may keep oil prices afloat even though crude inventories rise the most since 1982 as production remains below pre-pandemic levels.
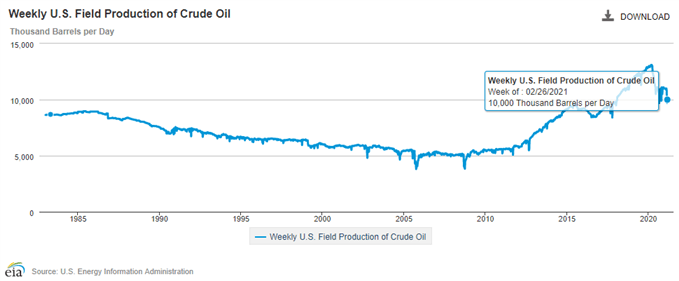
The most recent update from the US Energy Information Administration (EIA) showed weekly field production of crude recovering from the weather-related slowdown, with output climbing to 10,000K from 9,700 in the week ending February 19 to market the rise in three weeks.
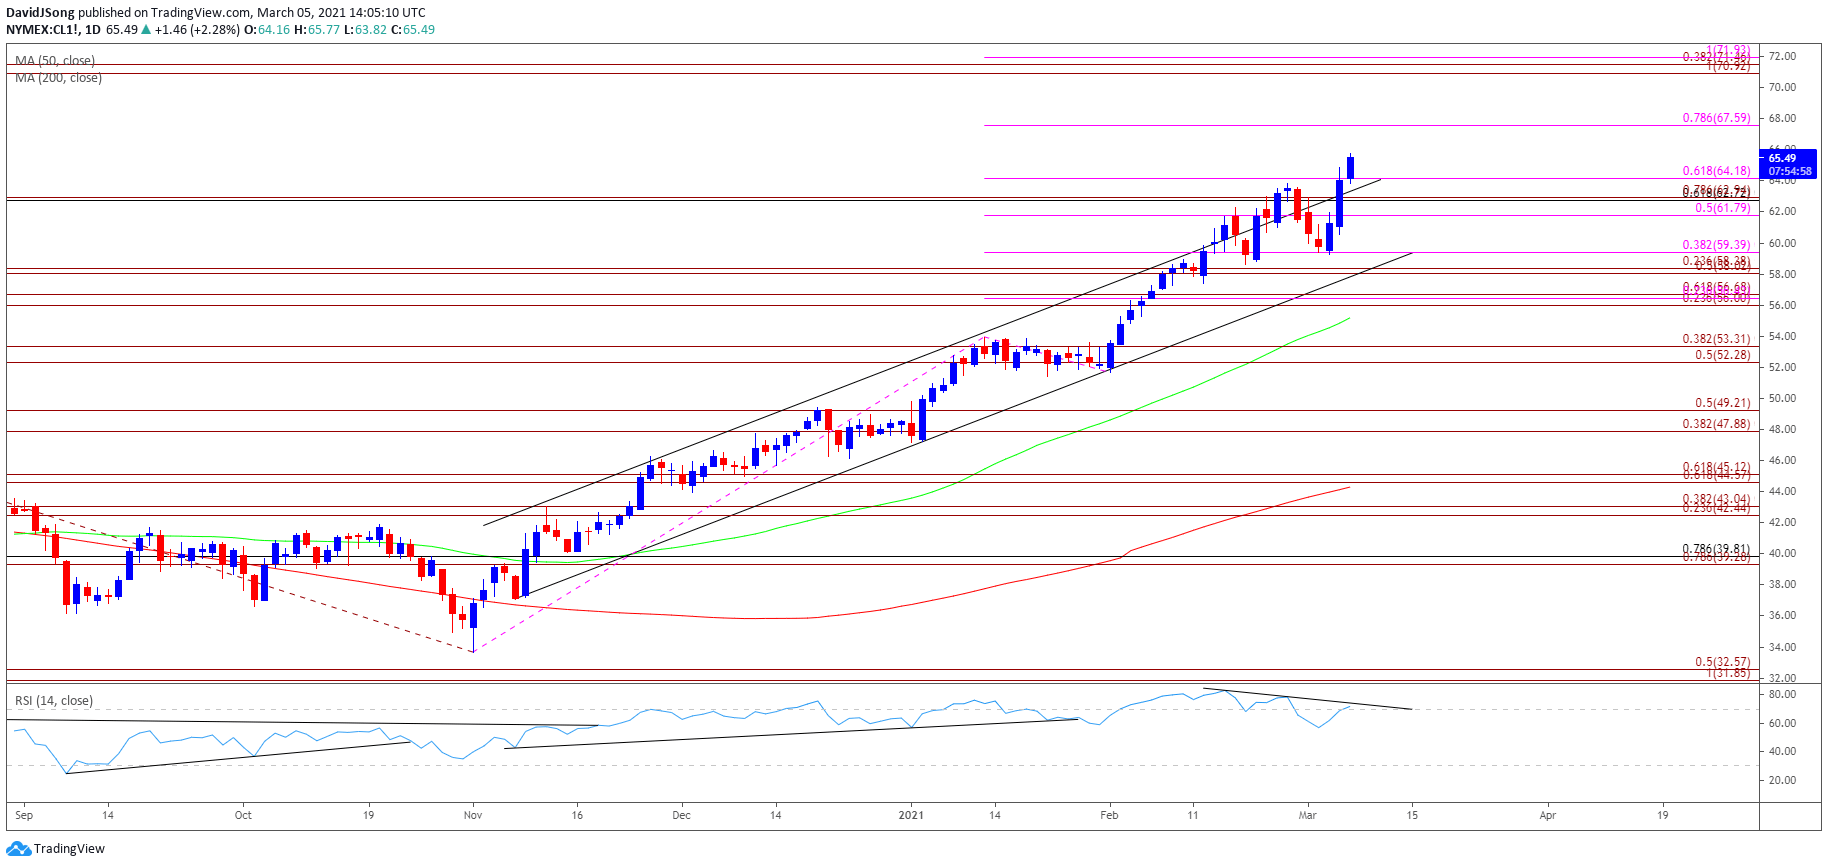
With that said, oil prices may continue to track the ascending channel established in November as crude output remains subdued, and the price of oil appears to be on track to test the 2019 high ($66.60) as it extends the series of higher highs and lows from the monthly low ($59.24).
At the same time, recent developments in the Relative Strength Index (RSI) indicate that the bullish momentum could gather pace as it pushes back above 70, and the extreme reading in the oscillator is likely to be accompanied by higher oil prices like the behavior seen earlier this year.
Oil Price Daily Chart
Source: Trading View
- Keep in mind, crude broke out of the range bound price action from the third quarter of 2020 following the failed attempt to close below the Fibonacci overlap around $34.80 (61.8% expansion) to $35.90 (50% retracement), and the price of oil appears to be on track to test the2019 high ($66.60)as both the 50-Day SMA ($55.19) and 200-Day SMA( $44.30) track a positive slope.
- At the same time, crude has broken out of the range bound price action carried over from the end of January to extend the upward trend established in November, but the Relative Strength Index (RSI) failed to keep up as a break of trendline support emerged ahead of February, with a textbook sell signal taking shape ahead of March as the indicator slipped below 70.
- Nevertheless, the RSI appears to be on track to threaten the downward trend established in February as it push back into overbought territory, and the extreme reading in the oscillator is likely to be accompanied by higher oil prices like the behavior seen earlier this year.
- The break above the $64.20 (61.8% expansion) region brings the 2019 high ($66.60) on the radar, with the next area of interest coming in around $67.60 (78.6% expansion) followed by the Fibonacci overlap around $70.90 (100% expansion) to $71.90 (100% expansion).

--- Written by David Song, Currency Strategist
Follow me on Twitter at @DavidJSong


