


Gold Price Outlook Talking Points:
- Gold prices remain in a corrective state, clinging to a bull flag formation even as the US Dollar has fallen through key areas of support.
- The bullish theme in Gold prices remains with potential but, at this stage, buyers have shown little responsiveness to USD-weakness, indicating that a deeper pullback may be around-the-corner should any element of relief show in the US currency.
- DailyFX Forecasts are published on a variety of markets such as Gold, the US Dollar or the Euro and are available from the DailyFX Trading Guides page. If you’re looking to improve your trading approach, check out Traits of Successful Traders. And if you’re looking for an introductory primer to the Forex market, check out our New to FX Guide.
Gold Prices Hold in Bull Flag as USD Drops
It’s been a big week so far in the US Dollar with the currency continuing to fall as part of the Q4 bearish theme that’s shown in the USD. And while this level of USD-weakness would traditionally come along with bid support in Gold prices, that simply hasn’t shown, and this begs the question as to whether that bullish backdrop in Gold that was so pronounced earlier this summer is dead and gone or whether buyers are hanging out on the sidelines awaiting a more-compelling point of entry before pouncing again.
As looked at on Monday, Gold prices remain in a bull flag formation that’s been building ever since a key zone of long-term resistance came into play in early-August trade. At the time prices first began to encounter that support, RSI was showing heavily overbought, rivaling levels last seen on the weekly chart in 2011 when Gold prices topped-out above the 1900 level. As discussed then and multiple times since, this doesn’t necessarily spell doom-and-gloom for Gold prices so much as it urges caution from chasing.
I had looked within the near-term setup on Monday, spotting two different support zones. The nearer of those zones remains in-play has the 1475-1480 level has helped to hold support since then. But, bulls have yet to make a lasting mark as that support inflection has merely led to another lower-high.
Gold Four-Hour Price Chart
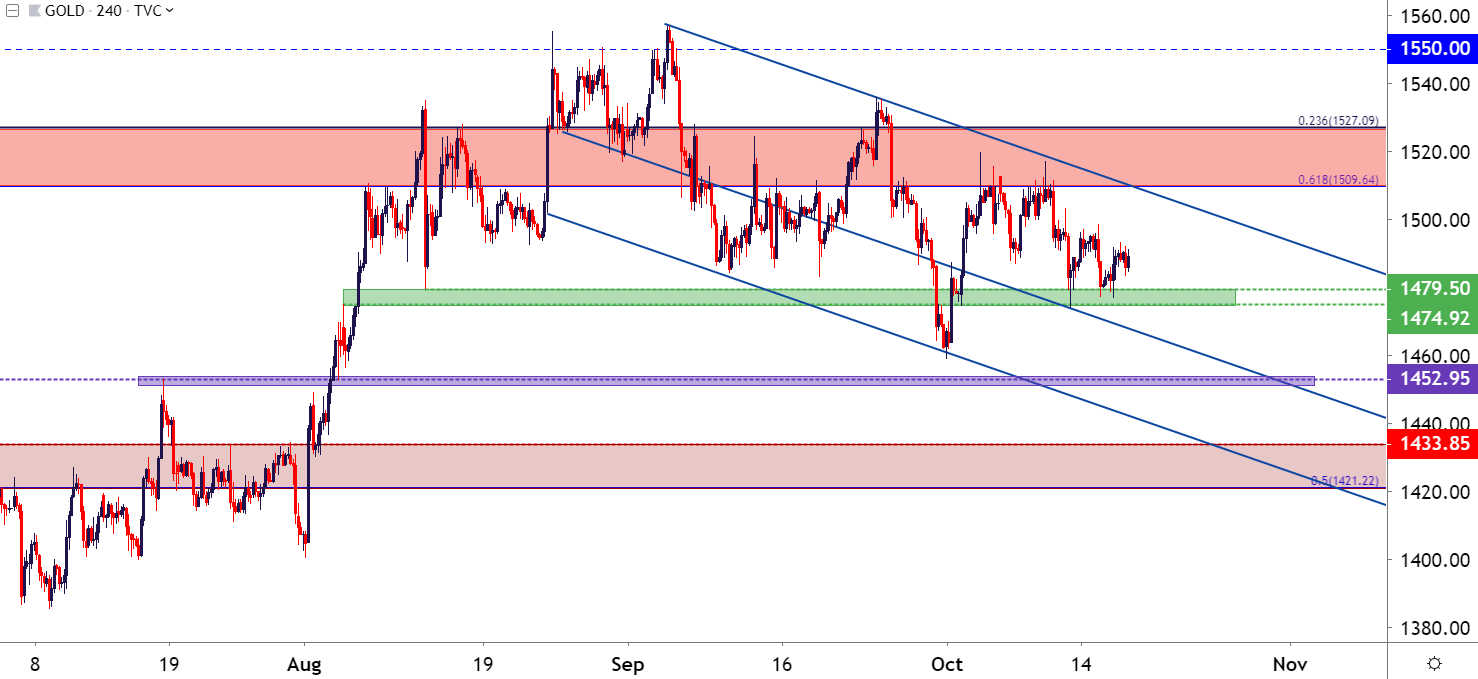
Chart prepared by James Stanley; Gold on Tradingview
Getting a bit closer to the price action of the matter, and those lower-highs coupled with continued support in the 1475-1480 zone may be spelling a near-term bearish move in Gold; and given the showing from Gold bulls so far this week as the US Dollar has fallen through its own support highlights how even a slight amount of relief in USD may help to push Gold down to the second zone looked at above, around the 1453 swing-high that showed in July trade that, as yet, hasn’t been tested for support since the early-August breakout.
Gold Price Two-Hour Chart
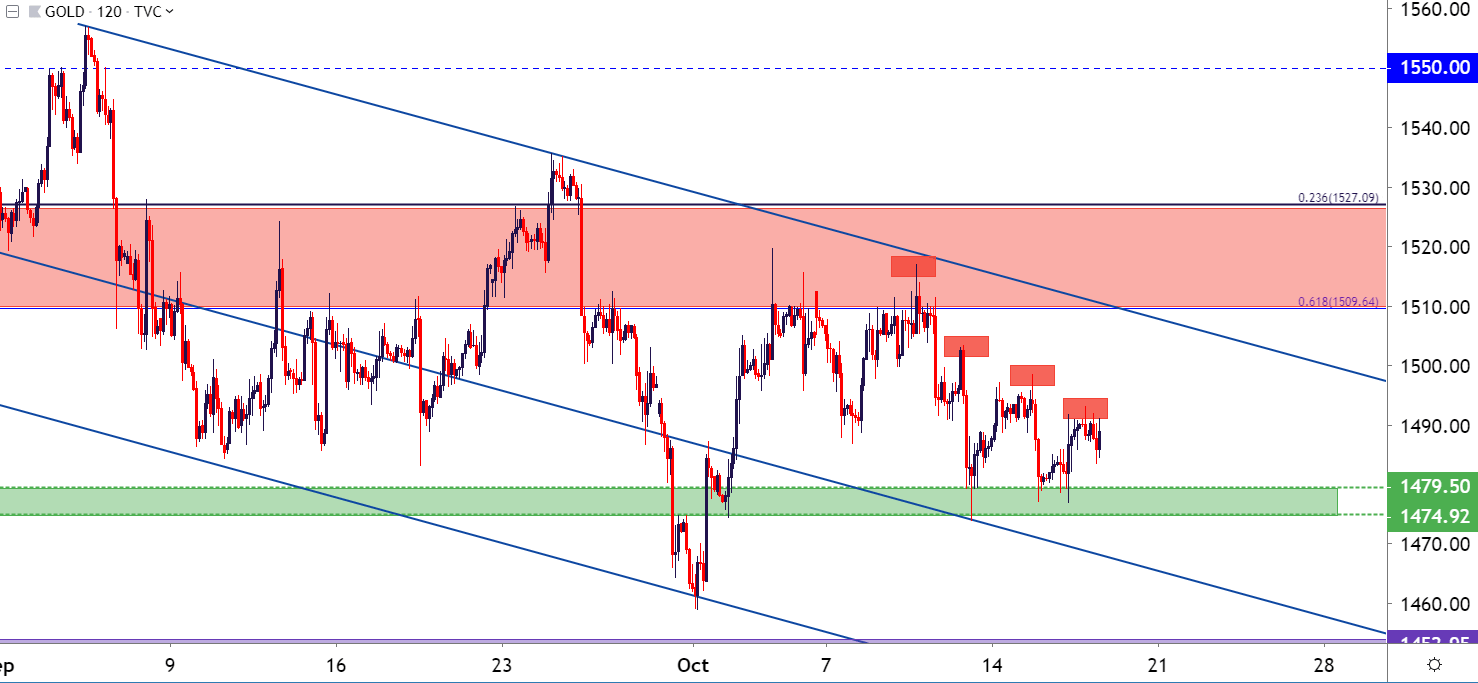
Chart prepared by James Stanley; Gold on Tradingview
Gold Price Strategy Moving Forward
In recent weeks, I’ve looked at bearish setups in the effort of trading within the bearish channel as part of the bull flag formation, and this was well supported by a key area of resistance in the zone that’s continued to deter the bullish backdrop in Gold, taken from Fibonacci levels at 1509 and 1527. But with prices now so far away from those highs and with sellers getting increasingly more aggressive while buyers are continuing to shy away from near-term resistance, and that bearish backdrop could be a bit more difficult to work with at the moment.
One possible scenario, and this would likely be reserved for short-term strategies of an aggressive nature, would be looking for a break of the low from last Friday at 1473.80. Deeper short-term support potential could be seen around prior swings around 1470, 1464 and then the October low around 1459. This would, in essence, be looking for a descending triangle breakdown on a short-term basis inside of the longer-term bull flag formation.
Gold Price Two-Hour Chart
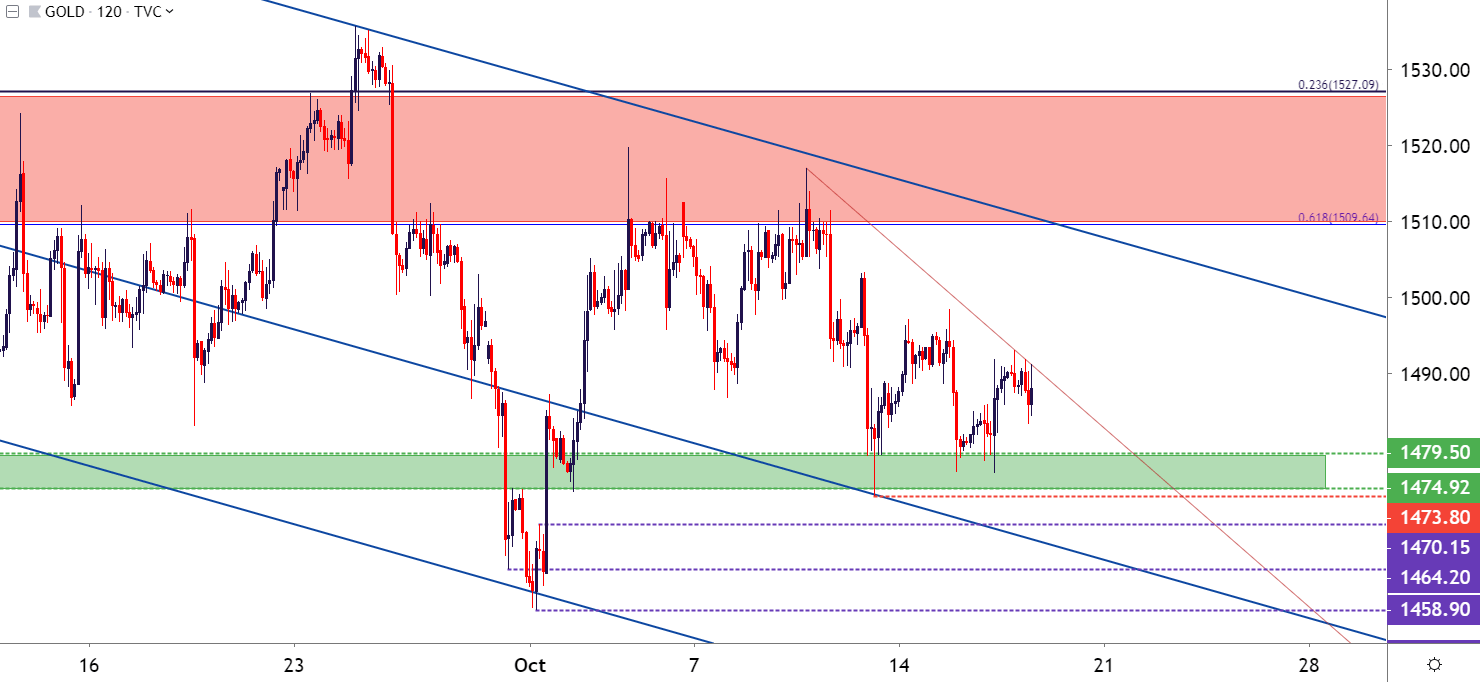
Chart prepared by James Stanley; Gold on Tradingview
The Bigger Picture Behind Gold Prices
The bullish backdrop remains and while this retracement/pullback is now working on its third month, that pullback has still been relatively shallow in the bigger picture. Taken the low set in last-August this pullback has only retraced as much as 23.6% of that prior move; which is where that early-October swing-low comes into play. This can keep the focus for most strategies on the long side of Gold with the primary question being one of timing as the bull flag formation hasn’t yet shown signs of giving way.
Gold Price Weekly Chart
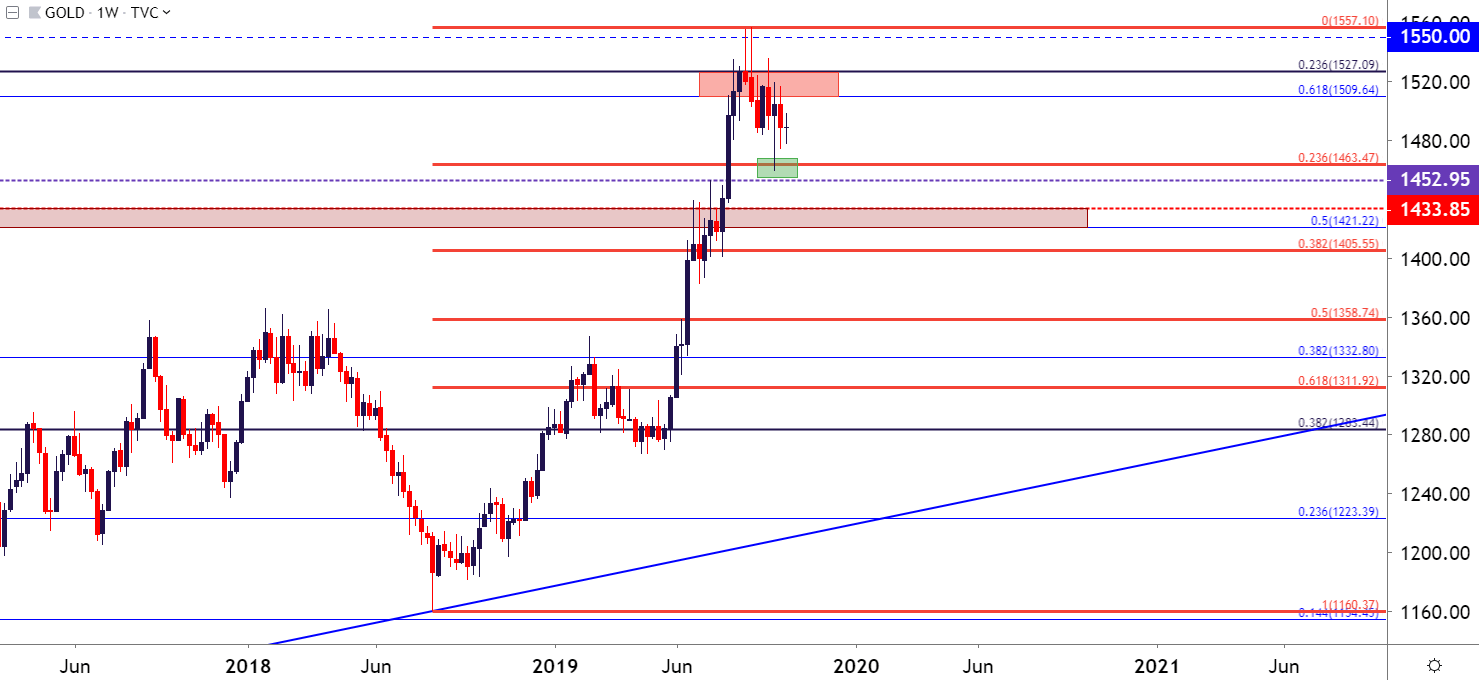
Chart prepared by James Stanley; Gold on Tradingview
This means that there are two possible approaches for Gold bulls here: Either way for buyers to push above the bearish channel or, alternatively, try to pick on support similar to what’s been followed in these articles over the past two weeks. Given the tread that’s shown around the 1475-1480 zone, traders would likely want to cast that focus for support a bit-lower, focusing on areas such as the 1464 or 1459 swing-lows looked at above or, perhaps even that 1453 swing-high from July that has yet to be tested for support since the early-August breakout.
Gold Price Eight-Hour Chart
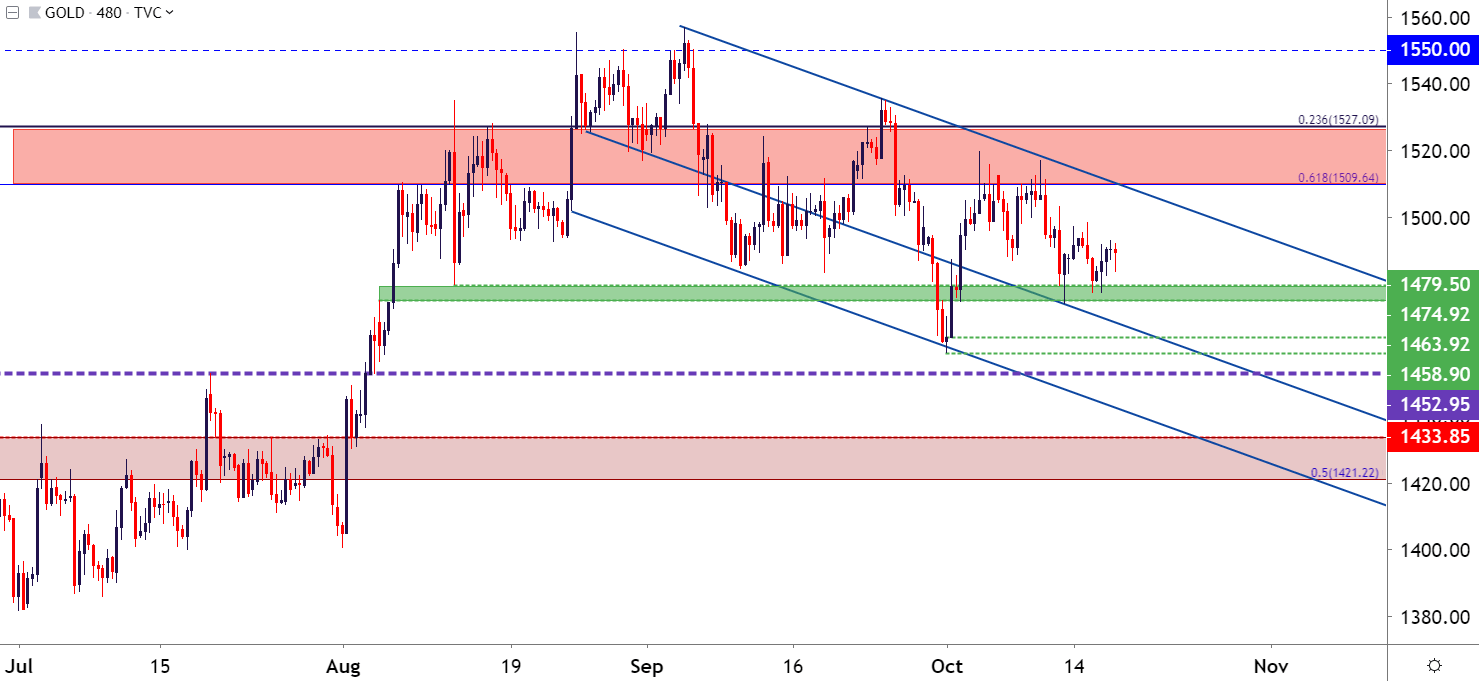
Chart prepared by James Stanley; Gold on Tradingview
To read more:
Are you looking for longer-term analysis on the U.S. Dollar? Our DailyFX Forecasts have a section for each major currency, and we also offer a plethora of resources on Gold or USD-pairs such as EUR/USD, GBP/USD, USD/JPY, AUD/USD. Traders can also stay up with near-term positioning via our IG Client Sentiment Indicator.
Forex Trading Resources
DailyFX offers an abundance of tools, indicators and resources to help traders. For those looking for trading ideas, our IG Client Sentiment shows the positioning of retail traders with actual live trades and positions. Our trading guides bring our DailyFX Quarterly Forecasts and our Top Trading Opportunities; and our real-time news feed has intra-day interactions from the DailyFX team. And if you’re looking for real-time analysis, our DailyFX Webinars offer numerous sessions each week in which you can see how and why we’re looking at what we’re looking at.
If you’re looking for educational information, our New to FX guide is there to help new(er) traders while our Traits of Successful Traders research is built to help sharpen the skill set by focusing on risk and trade management.
--- Written by James Stanley, Strategist for DailyFX.com
Contact and follow James on Twitter: @JStanleyFX


