


Talking Points:
- The US Dollar remains extremely strong after last week’s bevy of data prints, and this weakness is despite the fact that rate expectations for June have continued to dwindle lower.
- This USD strength has created reverberations in notable markets such as USOil. Last week’s USD strength brought in what could be the initial stages of a topping or reversal pattern, and we go in-depth behind that below.
- If you’re looking for trading ideas, check out our Trading Guides. And if you want something more short-term in nature, check out our SSI indicator.
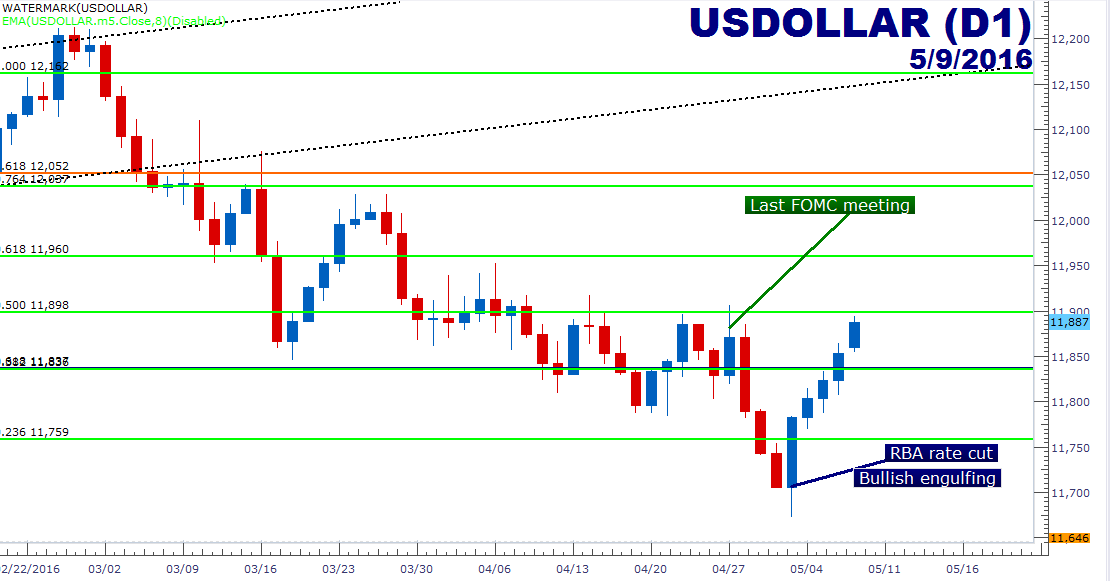
The US Dollar Rip continues; and this is now for the fifth consecutive trading day of higher prices going back to last Tuesday. USD is fast approaching the previous swing-high that printed on the chart just before the most recent FOMC statement was released on April 27th. Of course, the takeaway from that last rate meeting was one of FOMC-dovishness, as the prospect of a June rate hike became even more priced-out of the market. And on Friday we had Non-Farm Payrolls out of the United States, in which we saw a print of +160k versus an expectation of +200k jobs to have been added to American payrolls; and this just further reduces those expectations for a hike at the next Fed meeting in June.
But even with those lighter rate expectations, the US Dollar has continued to rise; and the reason is that other currencies have been that much weaker. In trading FX rates, everything is relative. So, even if USD is seeing net selling, if the currencies it’s being paired up with are seeing even more selling, then the US Dollar will go up simply by relative valuation. As in, last Tuesday brought us a surprise rate cut out of the Reserve Bank of Australia along with a dovish outlook for the months ahead. This has been bearish AUD/USD, which is one of the four constituents of the Dow Jones FXCM Dollar Index. So as traders sold Aussie on the back of this more dovish stance from the RBA, this has brought strength into USD, even though we’re also seeing lower rate expectations for the US economy.
Created with Marketscope/Trading Station II; prepared by James Stanley
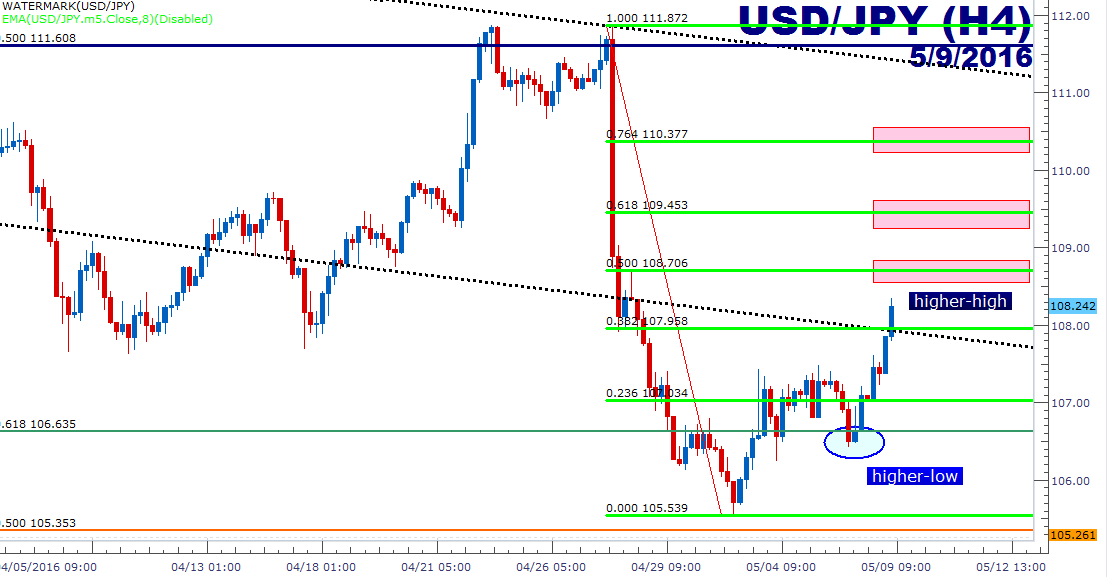
But perhaps even more important for global risk trends has been the weakness that’s been seen in the Japanese Yen after the rampant strength that ensued shortly after the BoJ left policy unchanged at their April meeting. This has been a much-needed bout of relief for the currency, and today’s burst of strength means another higher-high on the 4-hour chart; meaning that those looking to trade the bigger-picture down-trend are likely going to want to wait for price to show some element of resistance at a deeper level. On the chart below, we’ve added a Fibonacci retracement around the most recent major move to look for potential resistance levels.
Created with Marketscope/Trading Station II; prepared by James Stanley
Is Oil Topping?
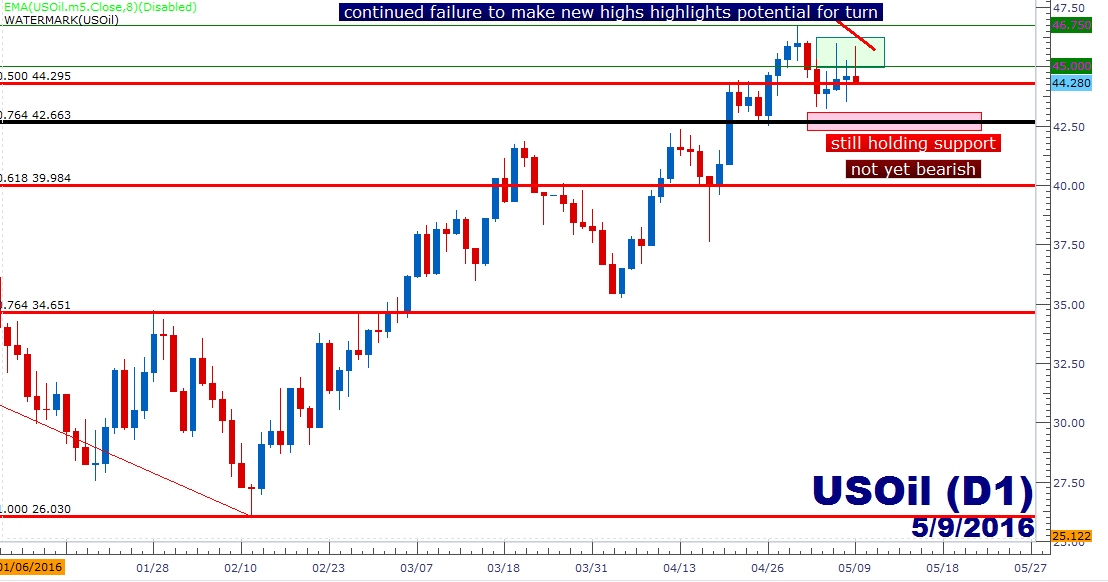
But perhaps more interesting as we open up the week is the early potential for a top in Oil prices; as this USD strength continued throughout last week, we saw Oil continually fail to make new highs. The price zone from $45-$46.75 has provided resistance now for a little over a week. This isn’t yet a bearish setup as support has held for now; but should support give way then price action could open the door for short-side setups in the direction of the prior trend.
Created with Marketscope/Trading Station II; prepared by James Stanley
The support levels of relevance are at $44.29, and again at $42.66; with the former being the 50% Fibonacci retracement of the most recent major move (shown in red on the below chart), while the latter is the 76.4% retracement of the ‘big picture’ move in Oil, taking the low in the year 1998 to the high in 2008.
Perhaps more importantly these levels have been confirmed as support with recent price action. We take a more granular look at the setup on the 4-hour chart of USOil below. Notice that price action as of this writing is resting directly on the 50% Fib of the most recent major move in the $44.29 vicinity; but with full respect for the prior structure of higher-lows. But a bit lower at $42.66 we have the prior swing-low, and traders can use this as an initiation point for that next down-trend. Should this level give way, traders can then look to sell by attempting to catch the next ‘lower-high.’ In a new down-trend, fresh resistance will often show up around old support, and traders can attempt to utilize this logic to trade new trends while still concentrating risk outlay.

Created with Marketscope/Trading Station II; prepared by James Stanley
--- Written by James Stanley, Analyst for DailyFX.com
To receive James Stanley’s analysis directly via email, please SIGN UP HERE
Contact and follow James on Twitter: @JStanleyFX


