


GOLD PRICE OUTLOOK:
- Gold prices badly beaten following FOMC policy pivot
- Flattened yield curve hints scope for rate hikes limited
- Near-term rise from support may probe above 1800/oz
Gold prices idled in Asia-Pacific trade, licking their wounds after another day of brutal selling in the wake of this week’s momentous Federal Reserve monetary policy announcement. The US central bank signaled a sooner rise in interest rates than was previously expected, which seemingly implied that scaling back QE asset purchases may happen on an accelerated timeline.
Not surprisingly, this hurt the non-interest-bearing and perennially anti-fiat yellow metal as the US Dollar roared upward alongside shorter-term bond yields. Spot prices have suffered the worst-two day drop since mid-August 2020. Tellingly, that plunge marked the last key Fed policy pivot, when it signaled that it was done expanding its stimulus toolkit having eased radically at the onset of the Covid-19 outbreak.

Looking ahead, a lull in heavy-duty news flow may allow some space for consolidation, which may give gold prices a bit of room for a corrective recovery. While front-end Treasury yields have held onto gains since the Fed announcement – reflecting the markets’ hawkish interpretation of the central bank’s messaging – longer-dated rates declined. The closely-watched 10- to 2-year Treasury yield curve slope tellingly flatted.
This may suggest that markets saw the FOMC as pulling forward the onset of stimulus withdrawal without expanding scope for rate increases thereafter, implying a shallow cycle. Perhaps investors reckoned that if inflation is meant to normalize amid waning base-effect exaggeration in the wake of the pandemic, then growth itself may do so too. Such thinking might ease pressure on bullion somewhat.
GOLD TECHNICAL ANALYSIS
Gold prices have landed atop support in the 1755-65 congestion area. Breaking below that on a daily closing basis may broadly expose March bottom at 1676.10, with perhaps a bit of friction near 1720.80 along the way. Near-term resistance is in the 1797.63-1808.40 zone. Reclaiming a foothold above that probably puts resistance clustered around 1850 within reach.
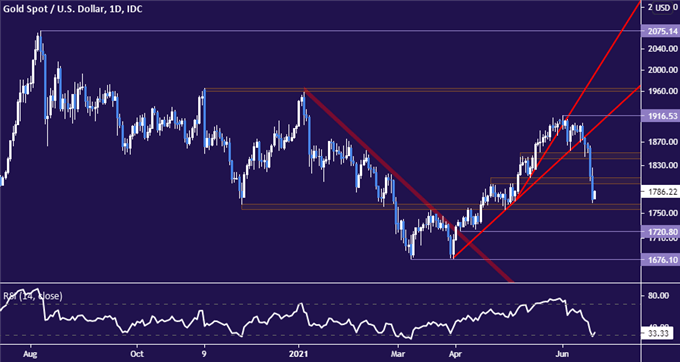
Gold price chart created using TradingView
GOLD TRADING RESOURCES
- What is your trading personality? Take our quiz to find out
- See our guide to build confidence in your trading strategy
- Join a free live webinar and have your questions answered
--- Written by Ilya Spivak, Head Strategist, APAC for DailyFX
To contact Ilya, use the comments section below or @IlyaSpivak on Twitter


