


CRUDE OIL & GOLD TALKING POINTS:
- Crude oil prices still trying to carve out double top below $44/bbl figure
- Gold prices advance to an 8-year high, inching closer to $1800/oz mark
- June FOMC minutes may hurt commodities on Fed stimulus bets deflate
Crude oil prices rose amid a broad-based upswell in risk appetite, with the WTI benchmark rising alongside US stocks. Gold prices also gained as the chipper mood undermined haven demand for the US Dollar, boosting the appeal of anti-fiat alternatives epitomized by the yellow metal.
A clear-cut catalyst for the risk-on tilt is not readily apparent. The move began before unexpectedly strong US consumer confidence data or a series of cautiously encouraging comments from policy officials including Fed Chair Powell and Treasury Secretary Mnuchin crossed the wires. Perhaps it owed to month- and quarter-end capital flows.
Looking ahead, the spotlight turns to minutes from June’s FOMC meeting. The outcome of that conclave produced the sharp bout of anti-risk liquidation that the pace-setting S&P 500 stock is yet to recover from. Comments suggesting the Fed has shifted into wait-and-see mode – limiting scope for near-term stimulus expansion – may sour sentiment and push commodity prices broadly lower.

CRUDE OIL TECHNICAL ANALYSIS
Crude oil prices are still flirting with the possibility of forming a double top below resistance in the 42.40-43.88 area as negative RSI divergence speaks to ebbing upward momentum. Trend turn confirmation likely demands a daily close below support at 34.78, which would expose the 27.40-29.11 inflection zone thereafter. Alternatively, a break above resistance seems likely to aim for the $50/bbl figure next.
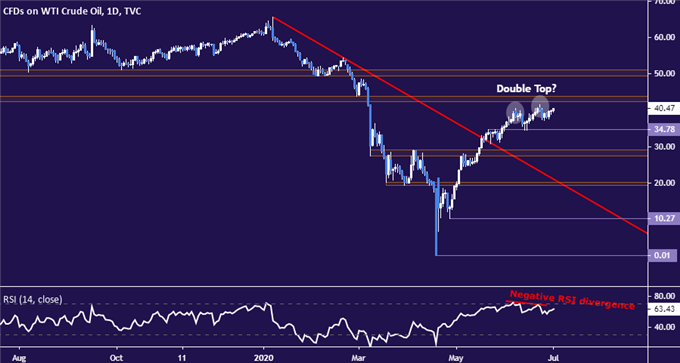
Crude oil price chart created using TradingView
GOLD TECHNICAL ANALYSIS
Gold prices are poised to challenge the 38.2% Fibonacci expansion at 1789.78. A break above that confirmed on a daily closing basis is likely to expose the 50% level at 1827.82 next. The recently broken range top at 1747.74 as been recast as immediate support, with a turn back below that setting the stage to revisit the 1679.81-93.92 region once again.
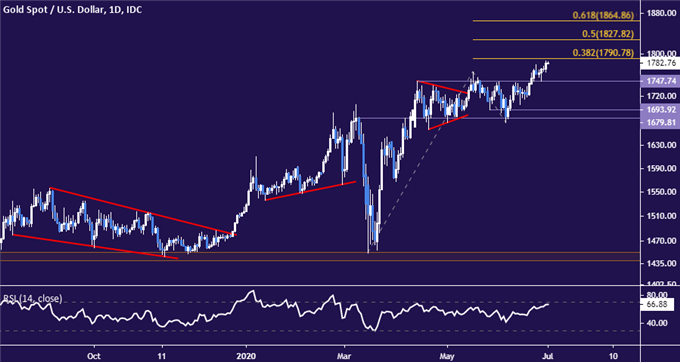
Gold price chart created using TradingView
COMMODITY TRADING RESOURCES
- See our free guide on the drivers of crude oil price trends
- What is your trading personality? Take our quiz to find out
- Join a free live webinar and have your questions answered
--- Written by Ilya Spivak, Head APAC Strategist for DailyFX
To contact Ilya, use the comments section below or @IlyaSpivak on Twitter


