


GOLD & CRUDE OIL TALKING POINTS:
- Crude oil, gold prices idle as all eyes turn to the FOMC rate decision
- Fed likely to keep policy on hold, might water down recent optimism
- Cautious tone may trigger chart setups hinting at gold gains, oil drop
Crude oil prices were little-changed despite API data showing US inventories rose 1.4 million barrels last week, clashing with expectations calling for a 2.9-million-barrel drawdown to be shown in official DOE statistics. An EIA report cutting the 2020 output forecast to 13.18 million barrels per day – from 13.29m b/d previously – seemed to fall on deaf ears as well.
Gold price action was likewise staid. The metal revisited the upper bound of the consolidation range carved out since Friday’s US payrolls-inspired plunge, then eased back into the close of the trading session. The moves echoed inverse swings in Treasury bond yields and the S&P 500 as underlying sentiment trends gyrated ahead of the week’s top-tier event risk.
The FOMC monetary policy announcement is now in focus. A change in rates is almost certainly not in the cards this time around, putting the spotlight on the accompanying policy statement as well as updated forecasts for key economic indicators and the path of the target Fed Funds rate. US CPI data is also on tap, but markets may overlook it as they wait for Fed Chair Jerome Powell and company to say their piece.
CRUDE OIL MAY WEAKEN AS GOLD GAINS IF FOMC DIALS DOWN OPTIMISM
Policymakers painted a rosy picture after last month’s sit-down, saying risks linked to the US-China trade war and a possible no-deal Brexit had diminished. They thus justified a move to wait-and-see mode, signaling a pause in the rate cut cycle until a “material” change in underlying economic conditions is observed. While no such shift is readily apparent, the Fed may have to rethink the external landscape.
Indeed, Washington and Beijing remain at loggerheads and seem to have grown further apart in recent weeks. Worse still, escalation may be imminent as the US prepares to trigger another tariff hike on December 15. Meanwhile, the fate of Brexit seems to hinge on the UK general election – this week’s other worry – where a widely expected Tory victory may yet be too narrow to ensure an orderly split from the EU.
This might nudge officials to tone down some earlier cheer. This might sour sentiment, nudging downward cycle-sensitive assets like crude oil. It may likewise bring down bond yields and weigh on the US Dollar, boosting the appeal of non-interest-bearing and anti-fiat alternatives. Needless to say, gold is likely to thrive against such a backdrop.
Join our live webinar coverage of the FOMC rate decision and its impact on financial markets!
GOLD TECHNICAL ANALYSIS
Gold prices remain locked within what looks like a bullish Falling Wedge chart setup. Confirmation on a daily close the pattern’s top at 1489.28 puts the 1516.05-23.05 area in the crosshairs. Alternatively, a turn below its floor – now at 1429.31 – may set the stage for a test below the $1400/oz figure.
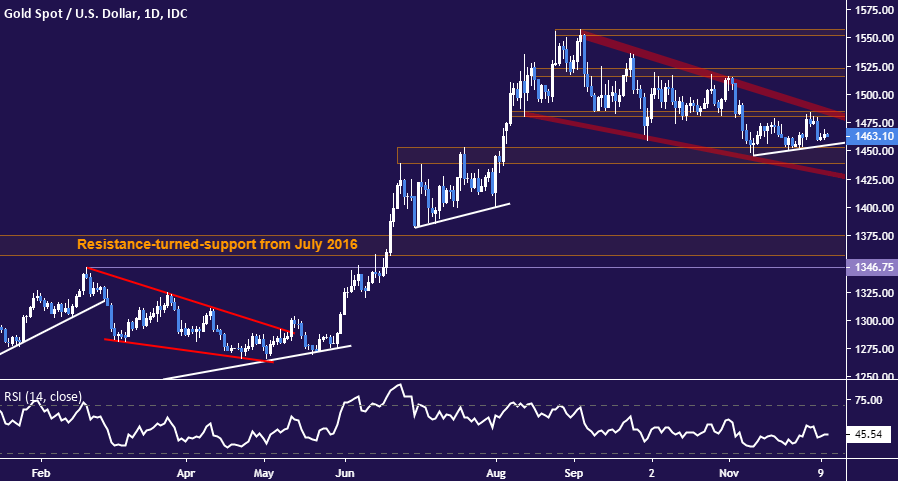
Gold price chart created using TradingView
CRUDE OIL TECHNICAL ANALYSIS
Crude oil prices continue to hover at resistance in the 60.04-84 area. Negative RSI divergence warns that a turn lower may be ahead, with a break below channel support (currently at 55.85) exposing the range bottom in the 50.52-51.00 zone. Alternatively, a push through resistance eyes the September’s high at 63.38.
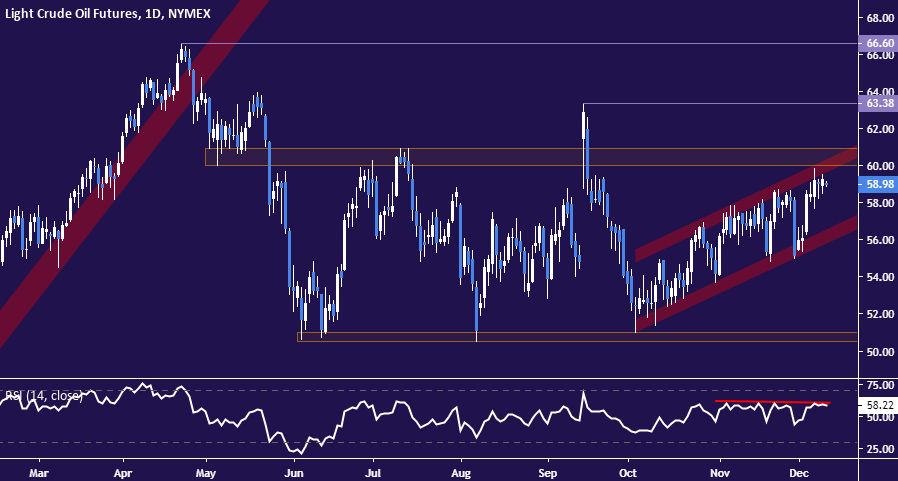
Crude oil price chart created using TradingView
COMMODITY TRADING RESOURCES
- See our guide to learn about the long-term forces driving crude oil prices
- Having trouble with your strategy? Here’s the #1 mistake that traders make
- Join a free webinar and have your commodity market questions answered
--- Written by Ilya Spivak, Currency Strategist for DailyFX.com
To contact Ilya, use the comments section below or @IlyaSpivak on Twitter


