FTSE100, DAX 40, S&P 500 Analysis and Charts
FTSE 100 gaps higher on Middle East de-escalation
On Friday the FTSE 100 dropped sharply, to its late February high at 7,751 as Israel fired missiles at Iran in a retaliatory attack in out-of-hours trading. The index then regained all of its losses and ended the day in slightly positive territory as Iran made it clear that it wasn’t interested in retaliation.
On Monday morning the FTSE 100 gapped higher and is fast approaching the psychological 8,000 mark which may offer short-term resistance with the 8,017 early April high. A weaker Pound Sterling is also aiding the recovery.
For the gap to be filled a fall through Monday’s intraday low at 7,944 to Friday’s high at 7,935 must occur.
FTSE 100 Daily Chart

| Change in | Longs | Shorts | OI |
| Daily | -10% | 1% | 0% |
| Weekly | -26% | 4% | -1% |
DAX 40 recovery is underway
The DAX 40 fell to levels last traded in late February when it hit the 17,400 mark as Israel launched missiles at Iran late last week.
Friday’s Hammer formation on the daily candlestick chart has been followed by a rise above Friday’s candlestick daily high at 17,773 on Monday morningwith the April downtrend line at 17,976 being in focus, together with the minor psychological 18,000 mark. Were a daily chart close above Friday's high to be made on Monday, at least a short-term bullish reversal pattern would be triggered.
Slips may find support along the 55-day simple moving average (SMA) at 17,733.Below it sit the 7 March 17,619 low and the 50% retracement of the mid-January to April advance at 17,490.
DAX 40 Daily Chart


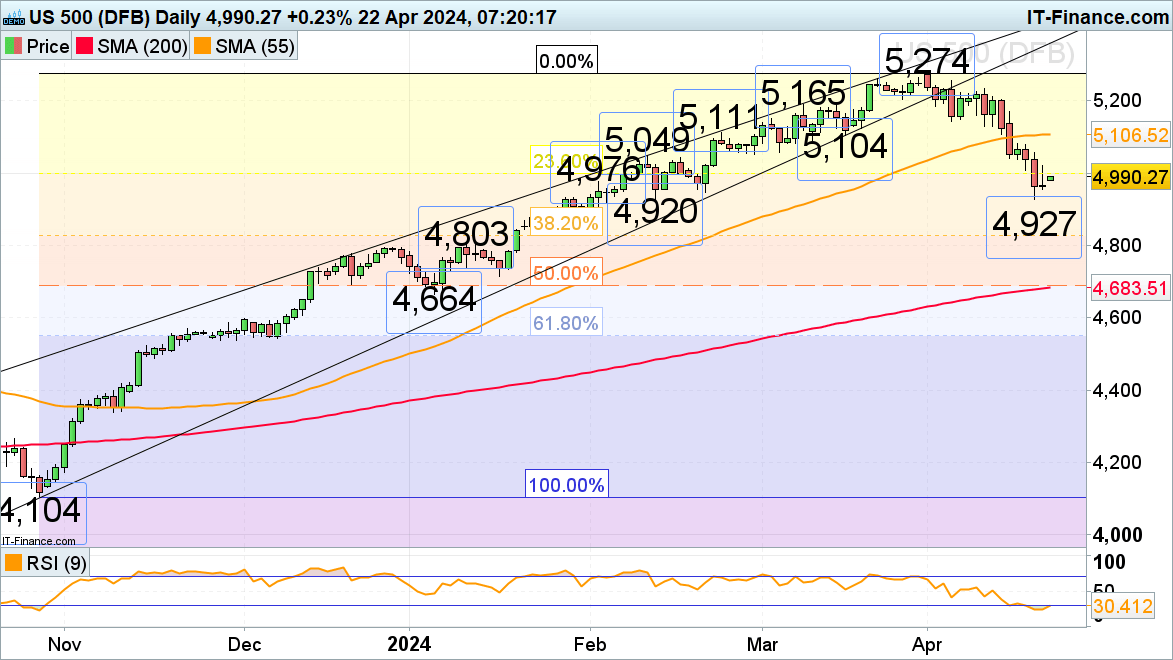
S&P 500 recovers from its two-month low towards the 5,000 mark
The S&P 500 saw three consecutive weeks of losses take it to a two-month low at 4,927 on escalating tensions in the Middle East and amid hawkish Fed speak as it hit levels last traded in mid-February.
The index is trying to regain some of its recently lost ground as the situation in the Middle East points towards de-escalation with the psychological 5,000 mark being back in focus. It may act as resistance, though. Further up sits the mid-February high at 5,049 which should also act as resistance.
Minor support below Friday’s Harami candlestick pattern low at 4,954 sits between Friday’s 4,927 low and the 4,920 mid-February trough.
S&P 500 Daily Chart


